Hello! As MSA (Microservices Architecture) and cloud-native environments become mainstream, the importance of Observability – the ability to understand system status and quickly resolve issues – has grown more than ever. 👨💻
Many of you are probably using Grafana to find meaningful insights within vast amounts of data. Today, we’ll go beyond just dashboards and delve deep into the open-source Avengers, the LGTM stack, which allows you to build complete Observability centered around Grafana!
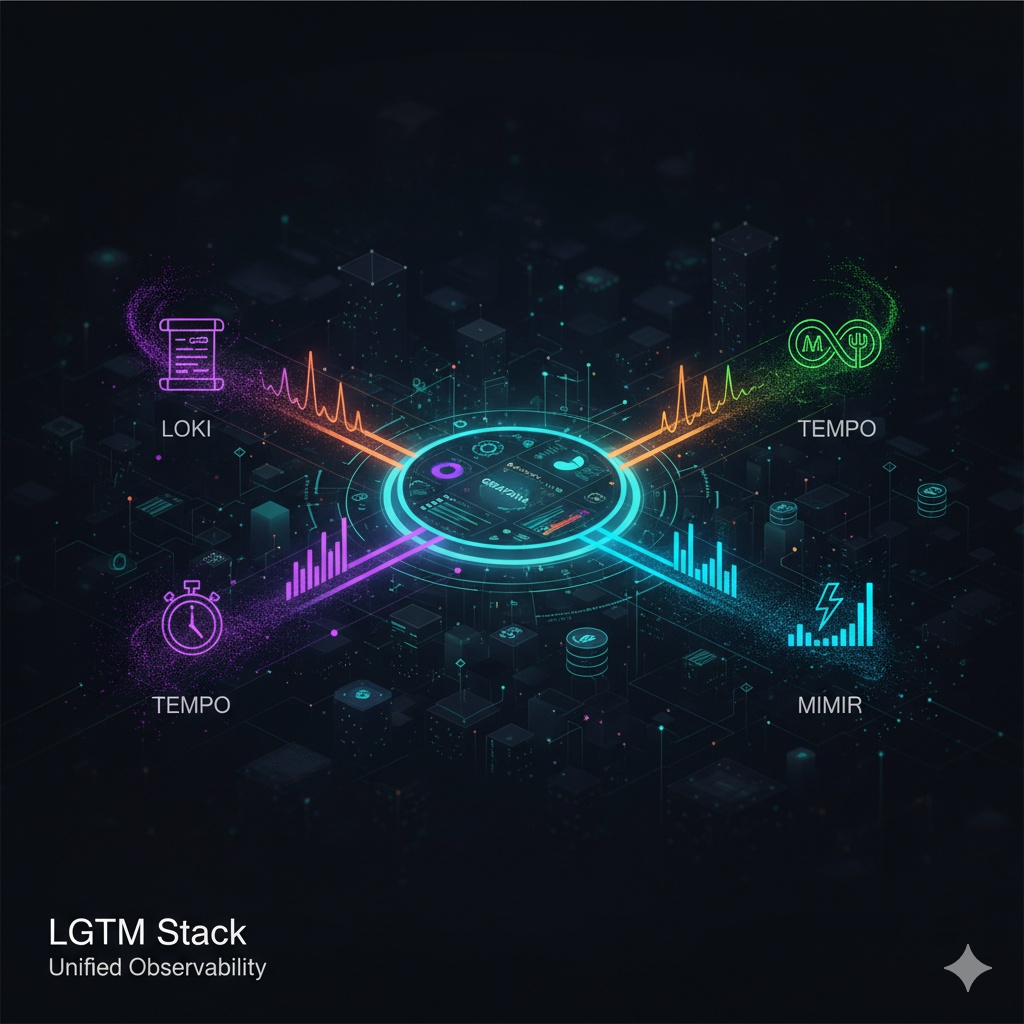
🤔 What is the LGTM Stack?
LGTM is widely known as a code review term, “Looks Good To Me,” but in the world of Observability, it’s an acronym for a powerful open-source stack led by Grafana Labs.
- Loki: Logging (Log collection and querying) 📜
- Grafana: Graphing & Visualization (Visualization and dashboards) 📊
- Tempo: Tracing (Distributed tracing) ⛓️
- Mimir: Metrics (Metric storage and querying) 📈
These four tools each handle one of the three pillars of Observability: logs, metrics, and traces. They allow all data to be organically connected and analyzed through a single interface, Grafana. It’s like scattered puzzle pieces coming together! 🧩
1️⃣ L for Loki: The New Powerhouse in Logging 📜
Traditional log solutions (e.g., ELK stack) provided powerful search capabilities by full-text indexing all collected logs, but this came with significant storage costs and resource usage.
Loki is the protagonist who changed this paradigm. It started with the idea: “Don’t index logs, only index metadata!”
- Key Features:
- Lightweight & Cost-Efficient: Instead of indexing the entire log content, it only indexes labels (metadata) like namespace=”production”, app=”api-server”. This significantly reduces storage costs and resources needed for indexing. 💰
- Easy Operation: Its simple structure makes installation and operation very easy.
- LogQL: Using a query language inspired by Prometheus’s PromQL, you can quickly and efficiently search and filter logs based on labels.
With Loki, you can store logs cost-effectively and retrieve them quickly when needed, much like Prometheus handles metrics.
2️⃣ G for Grafana: The Visualization Tool for Everyone 📊
Grafana is an undisputed superstar in the world of Observability. 🌟 Originally specialized in visualizing data from time-series databases (TSDBs) like Prometheus, it has now evolved into a versatile visualization platform supporting almost all types of data sources.
- Key Features:
- Diverse Data Source Support: Supports over 100 data sources in plugin form, including Prometheus, MySQL, PostgreSQL, Elasticsearch, AWS CloudWatch, and more.
- Beautiful and Flexible Dashboards: Anyone can easily create professional dashboards using a drag-and-drop method. It offers various panels and visualization options.
- Powerful Alerting Capabilities: You can set thresholds on specific panels in dashboards and send alerts to various channels like Slack, PagerDuty, and email. 🚨
- Unified UI: Acts as a gateway to explore and correlate all data (logs, metrics, traces) from the LGTM stack within a single UI.
3️⃣ T for Tempo: Easy and Massive Distributed Tracing ⛓️
In a microservices environment, a single user request involves complex calls between numerous services. It’s very difficult to identify bottlenecks or where errors occur in this process. Distributed Tracing is the technology designed to solve this problem.
Tempo was created to store and query such trace data at scale.
- Key Features:
- Index-less Design: Similar to Loki, instead of indexing all trace data, it uses a method of direct lookup via Trace IDs. This allows for storing and operating massive amounts of trace data on inexpensive object storage (S3, GCS, etc.).
- Simplicity: Compared to existing complex tracing systems like Jaeger and Zipkin, its structure is very simple and easy to operate.
- Integration with Logs and Metrics: From a Grafana dashboard, you can ‘drill down’ from a specific log or metric directly to its related trace. This allows you to instantly answer questions like, “What was the overall request flow at the time this error log was recorded?” 🧐
4️⃣ M for Mimir: Infinitely Scalable Prometheus 📈
Prometheus has become the standard for metric collection in container environments, but a single instance has limitations in storing and processing all metrics for large-scale environments over long periods.
Mimir was born to solve these scalability issues of Prometheus. It acts as a central repository that aggregates metrics from multiple Prometheus servers.
- Key Features:
- Horizontal Scalability: Designed with a microservices architecture, it can independently scale out each component as the load increases. It boasts monstrous performance, capable of processing billions of time-series data points. 💪
- High Availability: Data is stored in multiple replicas, allowing operations to continue without service interruption even if some components fail.
- 100% PromQL Compatibility: Existing Prometheus users can continue to use their query language (PromQL) and dashboards without any changes.
- Long-Term Storage: Utilizes inexpensive object storage to retain metric data for years.
✨ The LGTM Stack: Stronger Together!
The true power of the LGTM stack is unleashed when each tool is organically integrated within Grafana.
- 📈 Detect Anomalies on the Dashboard: You discover a sharp increase in the error rate (metrics, Mimir) of a specific service on the Grafana dashboard.
- 📜 Check Related Logs: With a single click, you immediately filter and view the error logs (Loki) for that time period.
- ⛓️ Trace the Entire Request Flow: By clicking on the Trace ID recorded in the error log, you can instantly understand which services the request passed through and exactly where delays or failures occurred, using trace data (Tempo).
All these processes happen seamlessly with just a few clicks, within a single screen. This is the integrated Observability experience provided by the LGTM stack.
✅ In Summary
The LGTM stack is Grafana Labs’ blueprint for modern Observability.
- Open-Source Based: No worries about vendor lock-in.
- Cost-Efficient: Minimizes indexing and utilizes inexpensive object storage to reduce TCO (Total Cost of Ownership).
- Immense Scalability: Can cover everything from small-scale projects to large-scale services targeting millions of users.
- Integrated Experience: Through Grafana, you can seamlessly navigate between logs, metrics, and traces, enabling true data-driven debugging and analysis.
Whether you’re a team just starting to adopt Observability or one struggling with the complexity and cost of existing systems, the LGTM stack will undoubtedly be one of the best choices. Add powerful insights to your system! 🚀
Tags: Grafana, LGTM, Observability, Loki, Tempo, Mimir, Prometheus, Monitoring, MSA, DevOps, SRE
Leave a Reply