Hello everyone! Today, I’d like to talk about a very powerful and intuitive method for understanding the health of the services we develop and operate at a glance: RED metrics. Specifically, we’ll delve into how these metrics can be easily generated and utilized through Trace Data!
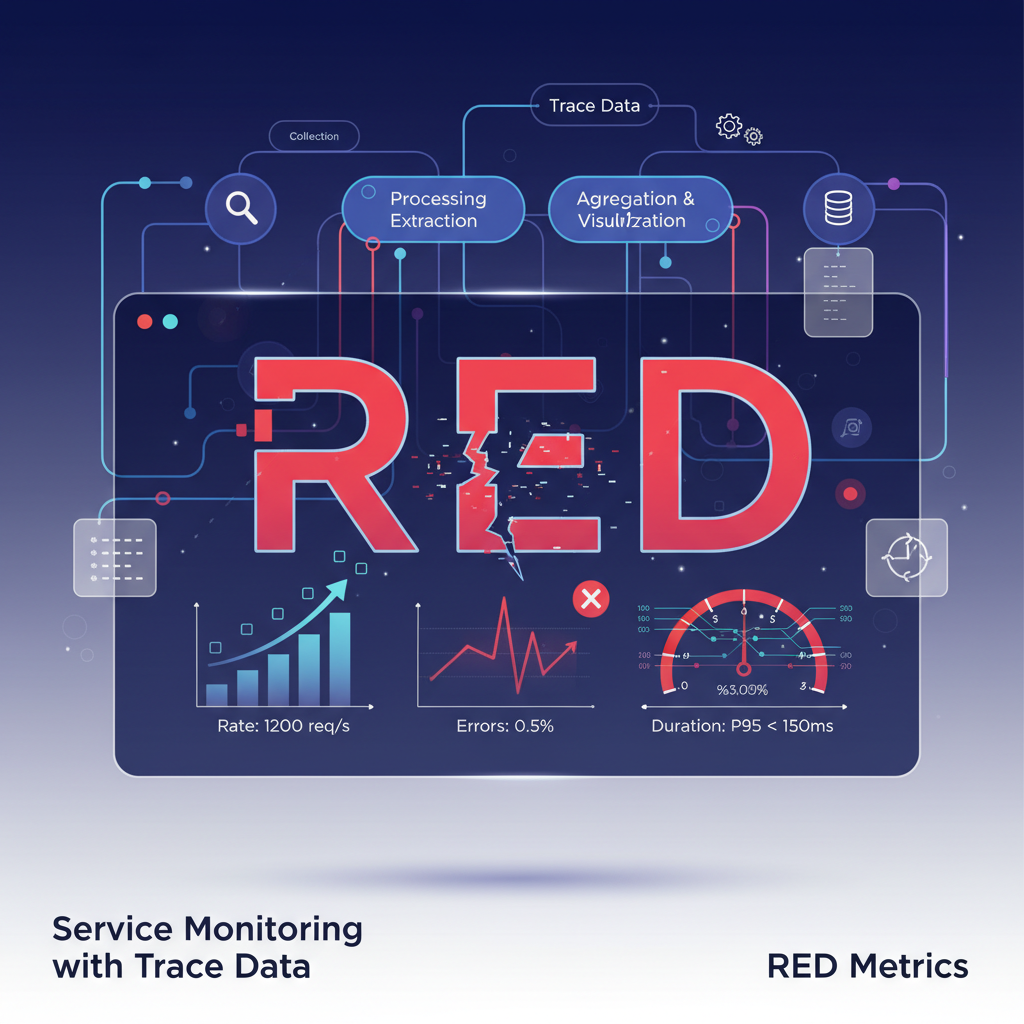
🤔 What are RED Metrics?
RED is an acronym for three key metrics used to understand the state of a service. It’s a simplified concept of Google’s SRE (Site Reliability Engineering) team’s ‘Four Golden Signals’, adapted for microservice environments, making it easy to remember and understand.
- 📈 Rate (Request Rate): The number of requests a service is processing per unit of time (usually 1 second).
- “How many users are currently flocking to our service?”
- Detects anomalies by identifying sudden increases or decreases in traffic.
- ❌ Errors (Error Rate): The proportion or number of failed requests out of the total requests.
- “How many errors are users experiencing?”
- An increase in error rate is the most direct signal that a serious problem has occurred in the service.
- ⏳ Duration (Response Time): The distribution of time taken to process each request.
- “How quickly is our service responding?”
- It’s important to check the 95th and 99th percentiles rather than just the average to understand the response speed experienced by most users. Longer response times degrade user experience.
By consistently observing just these three, you can confidently answer the question, “Is the service normal?”
🛤️ Why is ‘Trace Data’ the Best Ingredient?
Traditionally, these metrics were collected by analyzing log or metric data. However, using Trace Data makes it much easier and more accurate to obtain RED metrics.
A trace is data that records the entire journey of a user’s request from when it enters our system until it exits. A single trace consists of multiple spans, and each span represents a specific unit of work (e.g., API call, DB query).
Thanks to this journey record, we can easily obtain the following information:
- The start and end times of a single request (Trace) ➡️ Makes Duration calculation easy.
- The final success/failure status of a request (e.g., HTTP status code) ➡️ Clearly indicates whether there was an Error.
- The total number of requests received per unit of time ➡️ Allows accurate counting of the Rate.
In other words, trace data is like a treasure trove that already perfectly contains all the information needed to generate RED metrics. 💎
🔧 Generating RED Metrics in a Data Pipeline: A Step-by-Step Guide
So, let’s find out how RED metrics are actually created in a pipeline where trace data flows!
1️⃣ Step: Data Collection
Applications generate trace data using standard libraries like OpenTelemetry. This data is typically sent to a ‘Collector’, which is the first gateway in the data pipeline.
[Application] ➡️ [Collector]
2️⃣ Step: Data Processing & Extraction
The Collector or downstream data processing systems analyze the received trace data in real-time to extract the information needed for RED metrics.
- Rate: Counts the number of traces received during a specific time interval (e.g., 10 seconds). count(traces)
- Errors: Checks the status tags of each trace (e.g., status.code = ERROR, http.status_code >= 500) to count the number of error traces. count(error_traces)
- Duration: Calculates the response time (latency) by finding the difference between the start and end times of each trace. These values are then prepared for calculation as histograms or percentiles.
3️⃣ Step: Aggregation & Visualization
The extracted data is aggregated based on criteria such as service name and endpoint, and then sent to monitoring systems like Prometheus, Grafana, and Datadog.
[Collector] ➡️ [Monitoring System (e.g., Prometheus)] ➡️ [Dashboard (e.g., Grafana)]
Now we can monitor our service’s Rate, Errors, and Duration in real-time through a fantastic dashboard! 📊
✨ Advantages of Using RED Metrics
- Intuitiveness: Instead of complex metrics, focusing on just three allows for quick identification of problem situations.
- Standardization: The ability to evaluate the status of any service using the same criteria is particularly useful when managing multiple microservices.
- Rapid Response: Immediately detects anomalies and allows for quick action, such as “Error rate has surged!” or “Response time is slowing down!”
Now you too can build RED metrics using trace data and smartly manage the health of your services. The first step to stable service operation begins with accurate and intuitive monitoring! 🚀
Leave a Reply