Whenever a new AI model is announced, the question “Which AI has the best performance right now?” inevitably follows. However, if you search, some sites rank Claude first, others show GPT or Gemini leading, and in coding rankings, yet another model appears at the top.
This difference isn’t because any site is wrong. It’s because evaluations that ask people to choose their preferred answer, evaluations that automatically grade problems with correct answers, and agent evaluations that solve real GitHub issues measure different capabilities.
This article organizes commonly used AI performance comparison sites by their evaluation methods, as of July 31, 2026. We’ll also explore how to filter for signals relevant to your specific use case, rather than blindly trusting the numbers on a leaderboard.

First, the Conclusion: There is No Single ‘Global AI Overall Ranking’
AI models have various attributes that are difficult to express with a single test score.
- Does it produce answers preferred by humans in general conversation?
- Does it correctly answer math, science, and reasoning problems?
- Does it fix bugs in real software repositories?
- Is the response fast and the API cost reasonable?
- Can weights be downloaded and deployed in an internal environment?
- Does it reliably process long documents, images, and tool calls?
Therefore, the phrase “AI #1” must always be accompanied by evaluation criteria. The #1 in conversational preference, #1 in coding agents, and #1 in cost-effectiveness might be different models.
The most practical approach is not to look only at the overall score from a single site, but to cross-reference two or three evaluations depending on your purpose.
AI Performance Comparison Sites at a Glance
| Site | Mainly Measures | Evaluation Method | Best Suited Question | Caveats |
| — | — | — | — | — |
| Arena | User preference for answers in real use | 1:1 comparison between anonymous models and human voting | Which chatbot answer do people prefer more? | Influence of writing style and answer length may be mixed |
| Artificial Analysis | Intelligence, speed, latency, price, context | Multiple benchmarks and actual API measurements | How do quality, cost, and speed compare? | Need to check the composition of the overall index and execution settings |
| LiveBench | Latest multiple-choice/answer-based capabilities | New problems and objective automatic grading | What is the inference performance with reduced data contamination? | Does not represent the entire real conversation experience |
| SWE-bench | Ability to solve real repository issues | Code agent creates patches and runs tests | Can a coding agent fix real bugs? | Significant influence of agent structure and tool settings, not just the model |
| Hugging Face Leaderboards | Open-weight models and domain-specific evaluations | Public datasets, reproducible evaluation pipelines | How to compare open models for direct deployment? | The former Open LLM Leaderboard has been discontinued, and individual leaderboards have different purposes |
This table’s important part is the ‘Evaluation Method’. Even if the same model name appears, the results can differ if the prompt, inference strength, tool usage, sampling settings, and provided API are different.
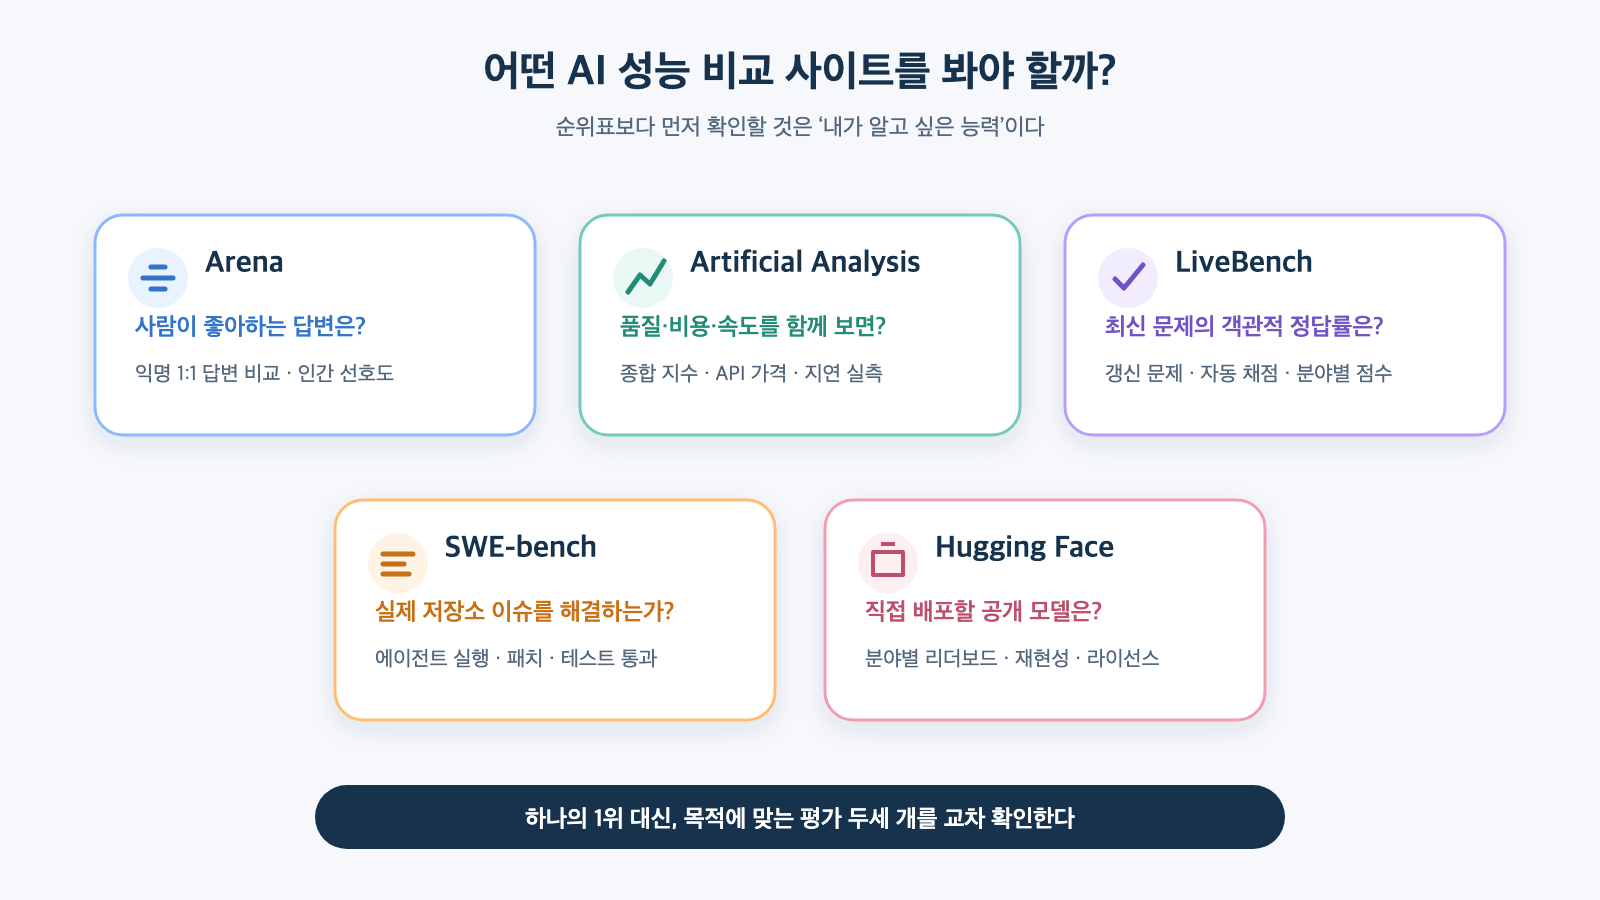
Figure: Guide to selecting comparison sites based on desired AI capabilities · Reconstructed based on Arena, Artificial Analysis, LiveBench, SWE-bench, Hugging Face Leaderboards
1. Arena — Compares answers actually preferred by humans
Arena shows answers to the same question from two anonymized models and asks users to choose the better answer. The cumulative results of these anonymous 1:1 battles are used to calculate the models’ relative rankings.
The strength of this method is that it reflects actual user experience, which is difficult to capture with fixed test problems. Human-perceived factors like naturalness of explanation, adherence to instructions, writing quality, and conversational flow are included in the voting.
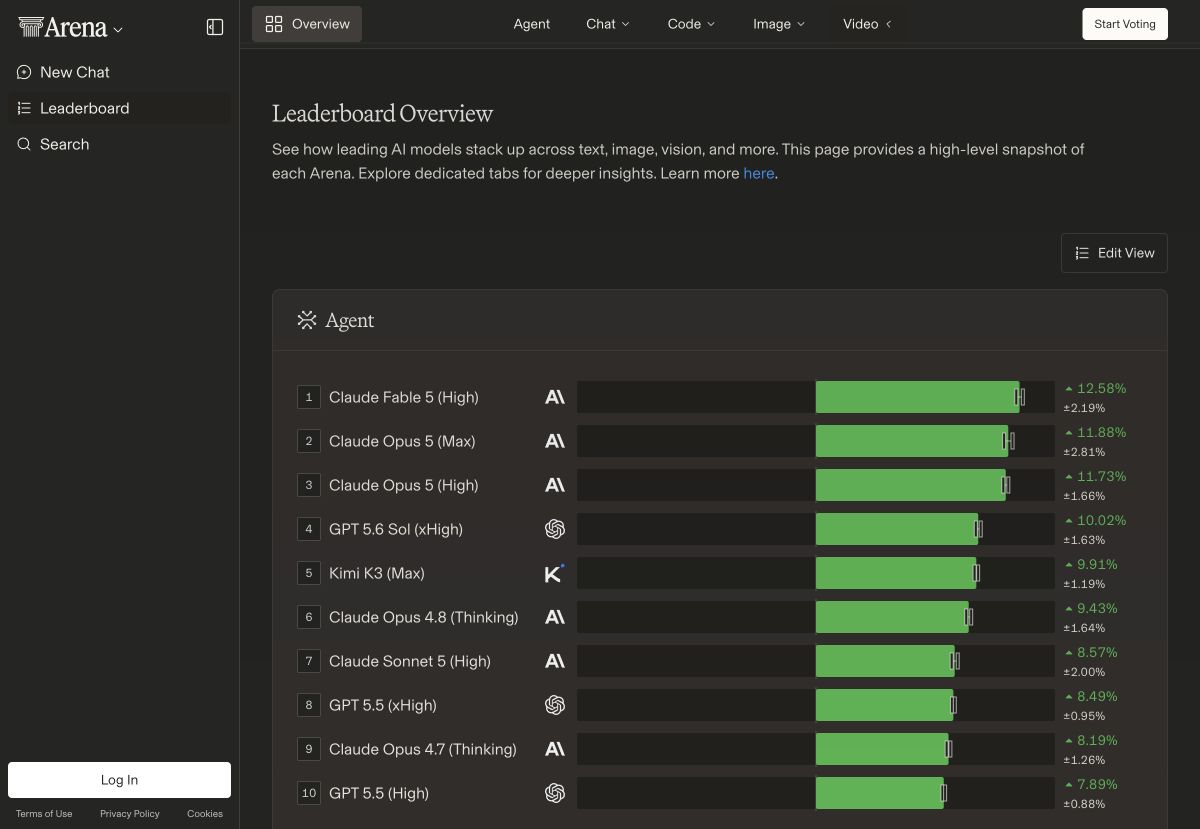
Screenshot: Agent rankings from Arena Leaderboard Overview · As of July 31, 2026 · Arena Official Leaderboard
Arena rankings are particularly useful in the following situations:
- When comparing overall answer satisfaction of general chatbots
- When looking for models where writing and explanation skills are important
- When seeing how a newly released model is received compared to existing models
- When checking detailed Arenas beyond text, such as vision and search
However, human preference does not necessarily equate to factual accuracy or business success rate. A long, elaborately structured answer might receive a better evaluation than its actual content warrants. Arena researchers have also analyzed that rankings can change if stylistic elements like answer length and Markdown usage are controlled.
Therefore, while Arena is strong for “Which answer did people prefer more?”, it is insufficient as a sole basis for “Which model solves math problems more accurately or fixes more real repository bugs?”
2. Artificial Analysis — Views performance, cost, and speed on one screen
Artificial Analysis compares not only a model’s intelligence score but also API price, output speed, time to first token, total response time, and context window.
As of July 2026, Intelligence Index v4.1 combines various evaluations including knowledge tasks, tool use, terminal coding, scientific reasoning, hallucination suppression, and long context reasoning. The site provides overall scores along with individual evaluation results, allowing users to check specific strengths rather than just the average.
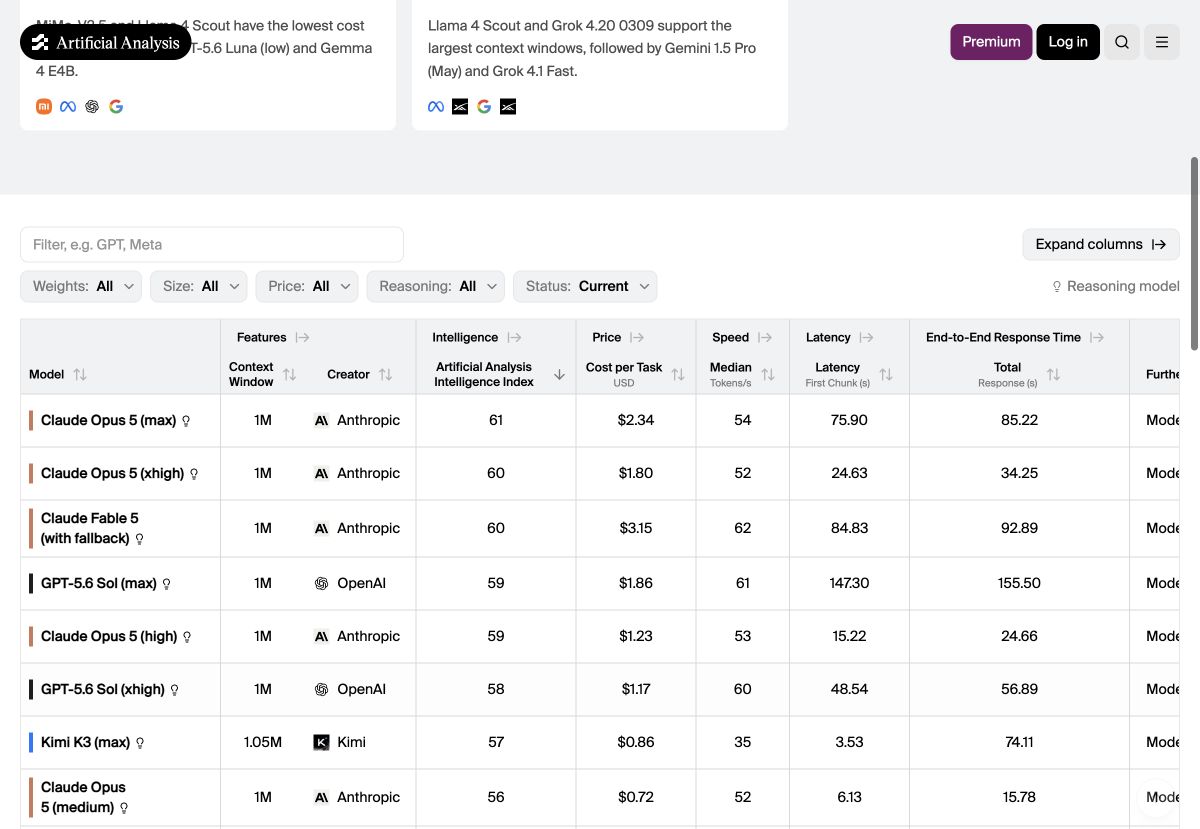
Screenshot: Comparison of Intelligence Index, cost per task, speed, and latency by model · As of July 31, 2026 · Artificial Analysis Official Leaderboard
Artificial Analysis’s biggest advantage is that it can connect model adoption to realistic product decisions. Even the highest-scoring model might not be suitable for large-scale services if its response is too slow or its cost per task is excessively high.
It is recommended to look at the following items together:
- Intelligence Index: A quality metric combining various abilities
- Individual Evaluations: Detailed scores related to tasks such as coding, knowledge, reasoning, and agents
- Cost per Task: The cost incurred to process one actual evaluation task
- Output Speed: Tokens generated per second after the first response
- Time to First Answer Token: Latency until the first answer appears, including inference time
- End-to-End Response Time: Time taken to receive an answer of a certain length completely
- Context Window: Maximum token range that can be processed, combining input and output
If you are planning an API-based service, this site is useful for finding ‘the model that delivers the highest quality within the latency and cost our service can afford’ rather than just the overall ranking.
3. LiveBench — Reduces data contamination with new problems
LiveBench was created to reduce the problem of score inflation due to benchmark problems being included in training data. It constructs problems from recent math competitions, papers, news, and datasets, and automatically grades them with correct answers.
The current site provides several categories separately, including reasoning, coding, agent coding, math, data analysis, language, and instruction following. You can view not only the model’s overall score but also sub-tasks and cost per successful task.
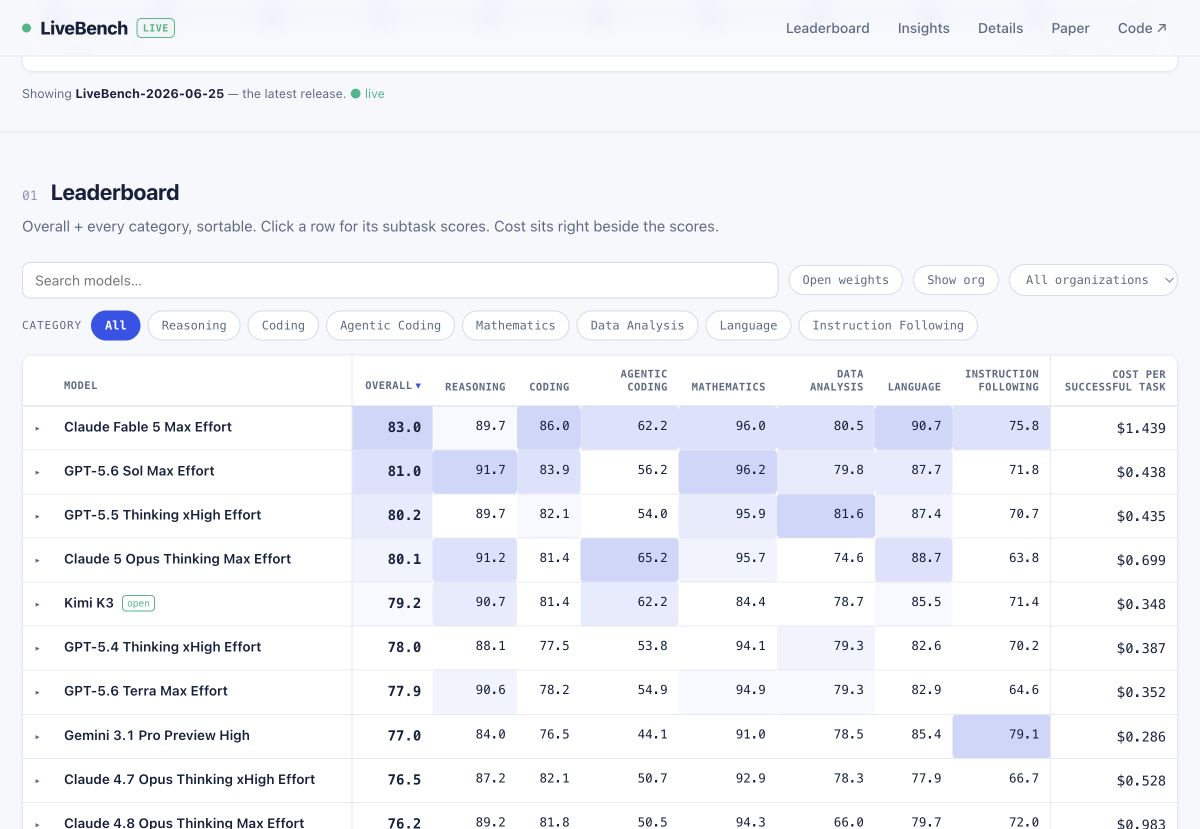
Screenshot: LiveBench latest release’s scores by domain and cost per successful task · As of July 31, 2026 · LiveBench Official Leaderboard
LiveBench is useful for the following reasons:
- Reduces the possibility that models have already learned old, famous test problems
- Prioritizes objective correct answers over subjective grading by humans or other LLMs
- Allows checking performance differences by domain, not just the overall average
- Can compare open models and private commercial models in the same category
However, objectively grading new problems does not fully replicate real-world tasks. Factors such as empathy in customer service, maintaining context in long projects, and RAG quality for finding evidence in internal company documents require separate experiments.
It is best to use LiveBench as a strong signal for ‘how accurately it solves new problems’ and supplement usability evaluations with Arena or internal task-specific tests.
4. SWE-bench — Evaluates coding agent systems, not just models
SWE-bench provides real open-source repository issues and code states, and evaluates whether an AI can analyze the problem, create a patch, and pass tests.
The representative SWE-bench Verified consists of 500 human-reviewed problems. There are also sub-leaderboards with different purposes, such as Multilingual, Lite, Full, and Multimodal, so you should first check if you are looking at the same dataset when comparing results.
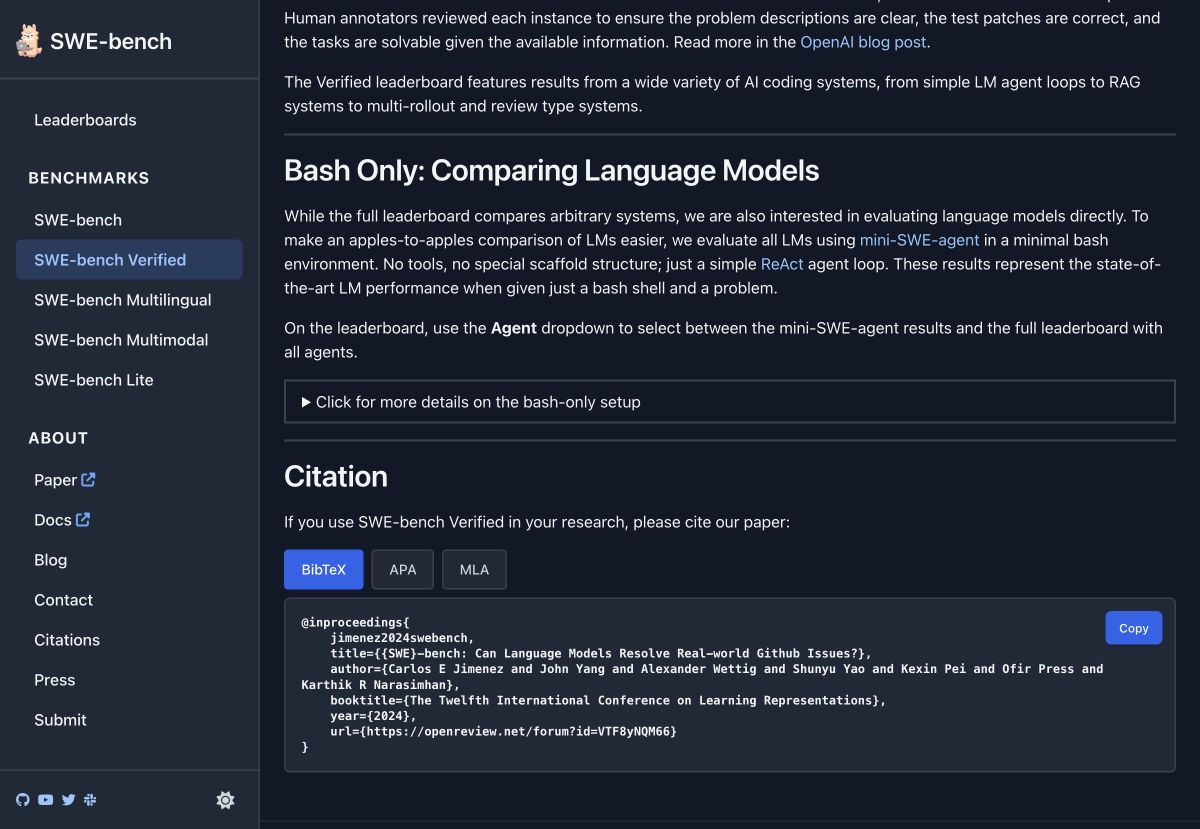
Screenshot: Resolution rate, average cost, and agent version from SWE-bench Verified official results table · As of July 31, 2026 · SWE-bench Official Leaderboard
SWE-bench scores are closer to actual software development tasks than simple code generation capabilities.
이슈 설명 읽기
→ 저장소 탐색
→ 관련 코드와 테스트 분석
→ 수정안 작성
→ 테스트 실행
→ 실패 원인 확인과 재수정
→ 최종 패치 제출
The important point here is that a single row on the leaderboard may not represent the model’s standalone performance. Even with the same model, the score can vary depending on which agent framework was used, how search, editing, and testing tools were provided, and what maximum cost and iteration limits were set.
When choosing a coding tool, you should also check the following:
- Is it the same SWE-bench sub-dataset?
- Are the model and agent versions identical?
- What are the tool call and iteration limits?
- What is the cost per problem and execution time?
- Have the submitted results undergone official verification?
SWE-bench is a key resource for comparing coding AIs, but its scores should be read not as ‘the pure intelligence of a language model’ but as ‘the success rate of a system combining model, prompt, tools, and agent’.
5. Hugging Face Leaderboards — View open models by domain-specific leaderboards
Hugging Face’s Leaderboards documentation provides methods for evaluating public models and datasets on the Hub and constructing leaderboards. It allows recording model weights, exact revisions, precision, and evaluation settings, which is useful when prioritizing reproducibility and direct deployability.

Screenshot: Evaluation results, community leaderboards, and Open LLM Leaderboard distinction on Hugging Face Hub · As of July 31, 2026 · Hugging Face Leaderboards Official Documentation
One change here must be noted: the widely known Hugging Face Open LLM Leaderboard officially ended in March 2025. The operators explained that while they evaluated over 13,000 models over two years, as inference models and assistants evolved, the existing evaluations gradually failed to accurately reflect current capabilities.
Therefore, instead of looking for a single ‘Hugging Face ranking’ table, you should now choose community leaderboards based on your purpose.
- Open-weight general-purpose language models
- Coding models
- Korean/multilingual models
- Vision-language models
- Embedding/reranking models
- Specific domain or custom dataset evaluation
When deploying open models internally, in addition to rankings, you should also check licenses, model size, active parameters, required GPU memory, quantization support, context length, and commercial use restrictions.
Why is the #1 ranking different on each site?
The reason why the #1 ranking differs across sites is due to different evaluation targets and grading processes.
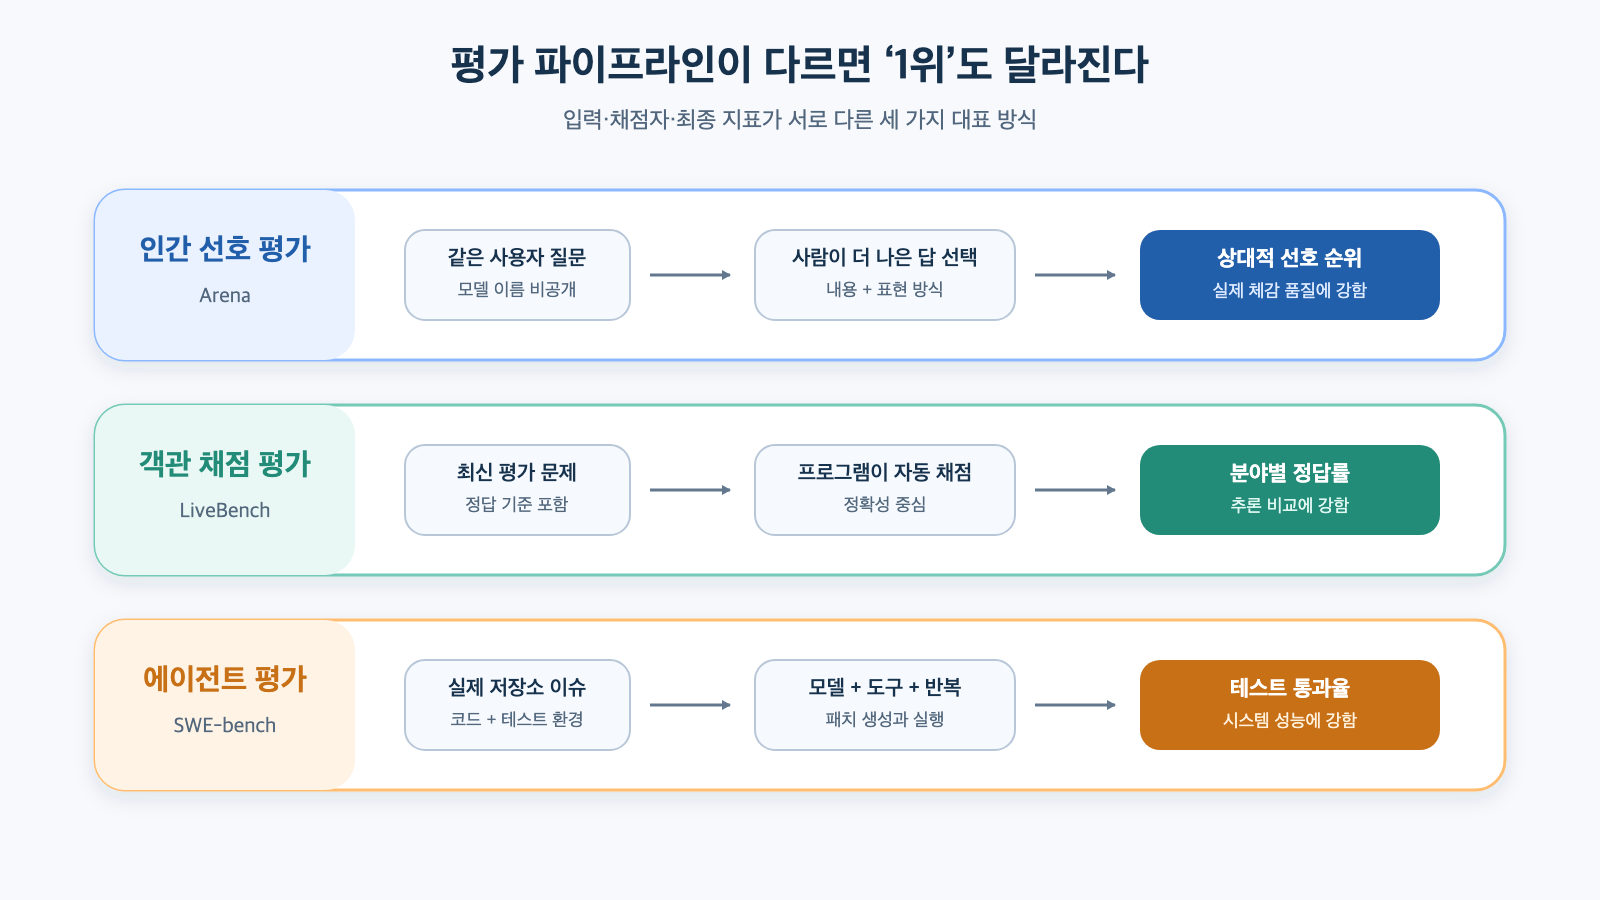
Figure: Differences in input, grading, and final metrics for human preference, objective grading, and agent evaluations · Reconstructed based on Arena research, LiveBench research, SWE-bench
Human preference and accuracy rates differ
In Arena, natural and friendly answers may receive high preference. In contrast, on LiveBench, scores are awarded only if the final answer is accurate. A visually appealing but incorrect answer will not receive a high score in a multiple-choice benchmark.
Model settings differ
Even the same model can yield different results depending on reasoning effort, temperature, system prompt, and whether tools are used. You should not assume that models are evaluated under the same conditions just because their names are the same.
Models and agents are different
In evaluations that perform multiple steps, like SWE-bench, not only the model but also the agent structure responsible for file search, code editing, test execution, and error recovery significantly impacts performance.
Evaluation timing differs
Commercial API models can be updated under the same name, and leaderboards vary in how quickly they reflect new models. You should check the model version and evaluation date next to the score.
Benchmark contamination and optimization exist
If publicly available test problems are included in training data or developers tune models to specific benchmarks, scores can be inflated beyond actual generalization performance. This is why sites like LiveBench update their problems.
8 Things to Check When Reading Leaderboards
- What is being measured: Preference, accuracy, coding success rate, or speed?
- Who is grading: Human, answer-based program, or LLM judge?
- Are the model settings the same: Are the inference strength and tool usage conditions identical?
- Are there versions and dates: Are specific versions being compared, not just model aliases?
- Are the sample size and confidence interval sufficient: Is a slight score difference statistically significant?
- Is cost included: Is the highest score sustainable within your actual budget?
- Are open weights and commercial APIs distinguished: Is it a model that can be deployed directly?
- Does it resemble my task: Are the evaluation problems sufficiently similar to actual use cases?
A 0.5-point difference between the top two models does not necessarily confirm superiority. If confidence intervals overlap or evaluation conditions differ, they may be at a virtually similar level.
Which site should I consult for my purpose?
General Chatbots and Writing
Check human preferences on Arena and supplement accuracy with LiveBench’s language and instruction-following scores. Finally, run your own set of questions, including Korean writing style and fact-checking.
API-based Services
On Artificial Analysis, look at intelligence, time to first response, total response time, and cost per task together. After narrowing down to two or three candidates, perform load tests with actual traffic length and system prompts.
Coding Agents
Compare the same dataset and agent conditions on SWE-bench. Beyond simple code problem scores, check repository navigation, test pass rates, and cost per problem.
In-house Deployed Open Models
Find candidates on Hugging Face’s domain-specific leaderboards and check licenses and hardware requirements. Then, internally evaluate company documents, Korean language support, security policies, and RAG search quality.
Research and Objective Reasoning Ability
Cross-reference updated answer-based evaluations like LiveBench with individual benchmarks from Artificial Analysis. Prioritize sub-tasks closer to your research area over overall scores.
The Most Accurate Method is to Create a Small Internal Leaderboard
Public leaderboards are tools for narrowing down candidates, not for making final purchasing decisions. Creating 30-100 evaluation problems that represent actual tasks will yield much more accurate conclusions.
공개 리더보드로 후보 3~5개 선정
→ 실제 업무 질문과 정답 기준 준비
→ 같은 시스템 프롬프트와 도구 조건 적용
→ 품질·지연·비용·안전성 측정
→ 실패 사례를 사람이 검토
→ 용도별 모델과 폴백 정책 결정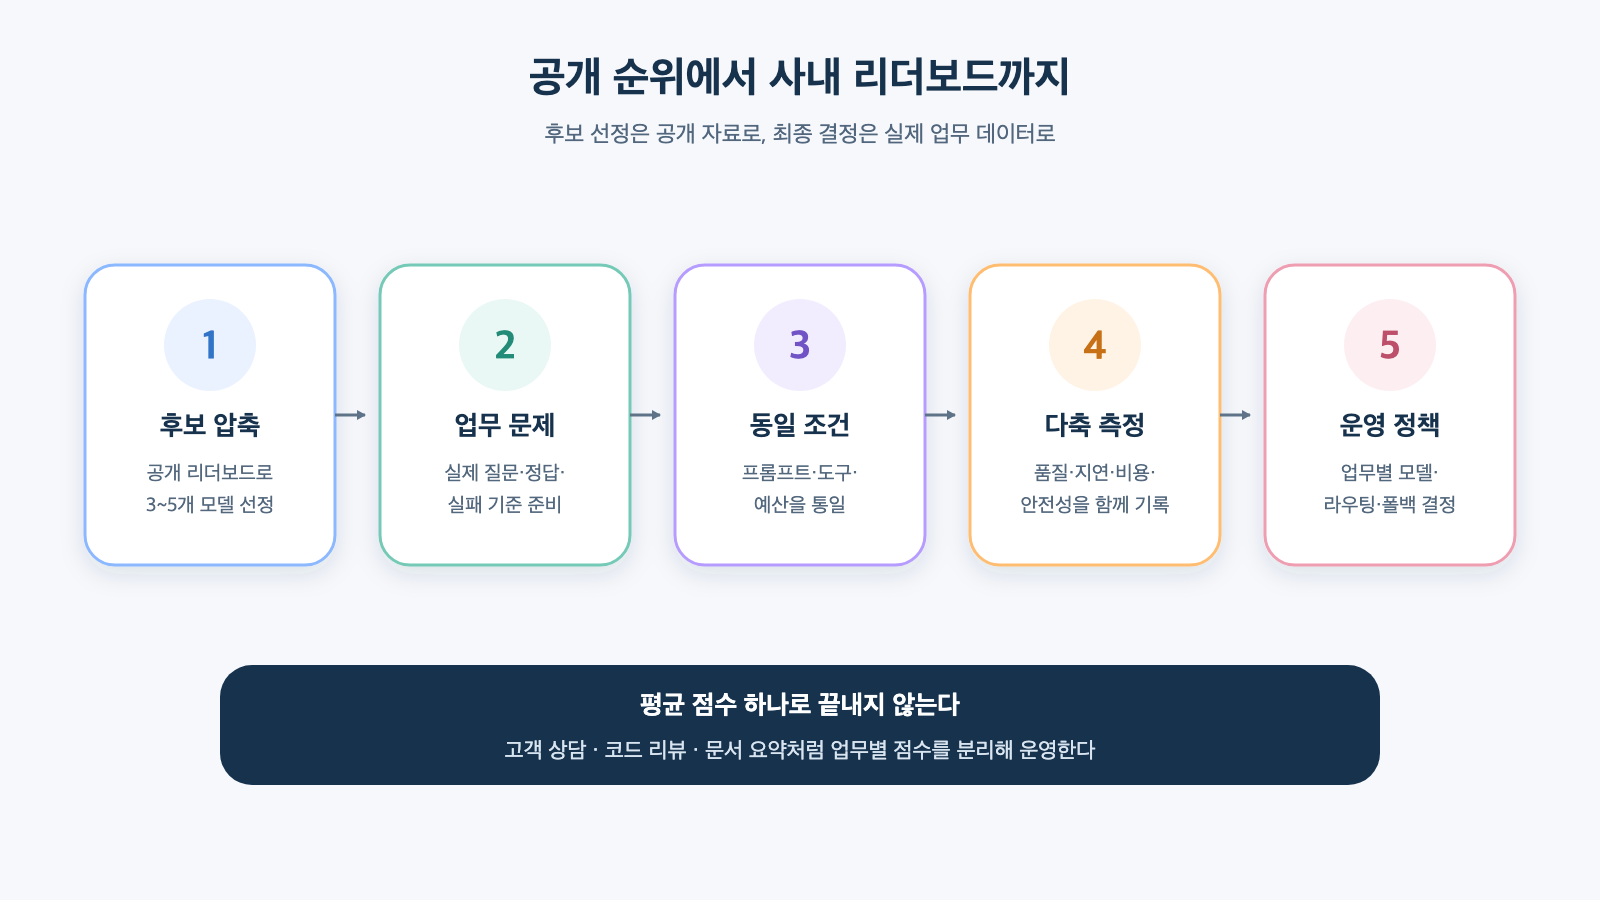
Figure: Internal evaluation flow from public leaderboard candidate selection to task-specific operational policies · Reconstructed based on Artificial Analysis model comparison method and the evaluation procedures in this article.
For example, a security team should evaluate the accuracy of vulnerability descriptions, evidence links, prevention of excessive attack instructions, log analysis, and the quality of Korean reports. For a development team, adherence to existing repository rules, test pass rates, scope of modifications, and token costs might be more important.
It’s better to separate scores by task, such as ‘customer support’, ‘code review’, or ‘document summarization’, rather than creating just one average score. This allows for designing task-specific routing or fallbacks instead of forcing a single model for all tasks.
Final Summary
AI performance comparison sites are not competing leaderboards but measurement tools that answer different questions.
- Arena shows actual user preference for answers.
- Artificial Analysis compares intelligence, price, speed, and latency together.
- LiveBench checks reasoning ability with new problems and objective grading.
- SWE-bench evaluates the real issue-solving capability of coding agents, combining models and tools.
- Hugging Face Leaderboards are a starting point for finding open models and reproducible evaluations by purpose.
Instead of choosing a model based solely on the phrase ‘World AI Ranking #1’, you should also check the evaluation method, model version, cost and latency, and similarity to your own tasks.
Narrowing down candidates with public rankings and performing small internal evaluations with real business data is the safest and most realistic way to choose an AI model.
Leave a Reply