Hello! 👋 Have you started basic node or database monitoring by adopting Prometheus? If so, the next step is likely ’embedding metrics directly into your application’, which is instrumentation.
However, when you actually try to start, you might find yourself pondering questions like “How should I name my metrics?”, “Which type should I use?”, or “Can I just add labels freely?”
Today, I’ll help alleviate your concerns and clearly summarize the core best practices for application instrumentation that will make people say, “You really know how to use Prometheus!”
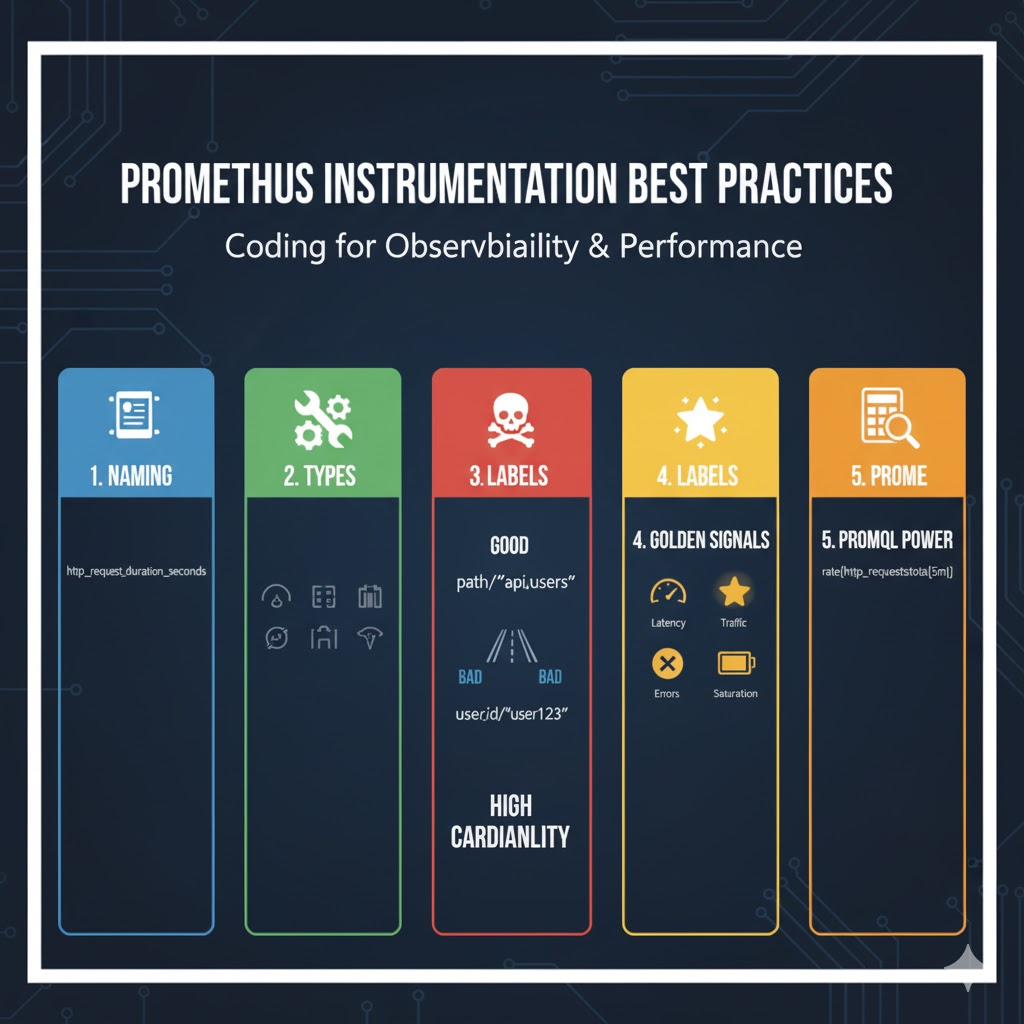
1. Consistent Naming: The Best Investment for the Future
This is the most basic yet most important rule. If metric names are inconsistent, it will lead to great confusion when querying with PromQL later. It’s best to follow the standard naming conventions below.
[library/application prefix]_[what is being measured]_[unit]
- Prefix: Clearly indicates which application or library the metric belongs to. (e.g., http_, prometheus_, api_)
- Metric Name: Clearly indicates what is being measured. (e.g., requests_total, request_duration_seconds)
- Unit: Specifies the unit of the metric. Especially for time, it is strongly recommended to use base units like seconds, and for data size, bytes. (Instead of ms, KB)
✅ Good Examples:
- api_http_requests_total: Total number of HTTP requests to the API server (counters use the _total suffix)
- process_resident_memory_bytes: Physical memory usage of the process (in bytes)
- http_request_duration_seconds: HTTP request processing time (in seconds)
❌ Bad Examples:
- requests: Unclear what kind of requests.
- memory: Unit is missing, unclear if MB or KB.
- http_latency_ms: Uses milliseconds (ms) instead of the base unit.
2. Choosing the Right Metric Type: Using the Correct Tool 🛠️
Prometheus has four metric types. Choosing the appropriate type for the situation ensures the data’s meaning is accurate.
- Counter 📈: Used for values that only increase. (e.g., cumulative request count, cumulative error count)
- rate(), increase() functions with it to calculate ‘requests per minute’, etc.
- Gauge 🌡️: Used for current state values that can go up and down. (e.g., current number of connected users, CPU utilization, number of tasks in a queue)
- Histogram 📊: Used to understand the distribution of observed values. Primarily used for measuring response time (Latency).
- Optimized for calculating percentiles (e.g., “95% of requests were processed within how many seconds?”) with the histogram_quantile() function. For most response time measurements, Histogram is the correct choice.
- Summary 📝: Similar to Histogram, but calculates percentiles directly on the client side. Aggregation is difficult, so Histogram is recommended except in special cases.
3. ⚠️ Most Important! Managing Labels and Cardinality
Labels are a powerful feature of Prometheus, but they can be a double-edged sword that can destroy your server if used incorrectly. The key is managing cardinality.
Cardinality is a measure that indicates how many unique combinations of label values exist.
- Low Cardinality 👍: The types of label values are limited. (e.g., method=”GET”, “POST”, status=”200″, “404”, “500”)
- High Cardinality 💣: Occurs when using values that can grow infinitely as labels, such as user IDs, emails, session IDs, or request IDs.
High cardinality is the main culprit for explosively increasing Prometheus server memory usage and severely degrading performance! You should never use unique identifiers as label values.
✅ Good Labels
Example: http_requests_total{method=”POST”, path=”/api/v1/login”, status=”200″} (method, path, status have limited types.)
❌ Labels to Absolutely Avoid
Example: http_requests_total{user_id=”user12345″, session_id=”a1b2c3d4e5f6g7″} (A new time series is generated infinitely every time a user increases.)
4. What to Measure? The Four Golden Signals ✨
The best answer to “So what exactly should I measure?” is the ‘Four Golden Signals’ proposed by Google SRE. You won’t fail if you focus your measurements on these four metrics, which directly impact user experience.
- Latency 🐢: The time it takes to process a request. It’s important to measure the time for successful requests separately from failed requests.
- Traffic 🚦: The amount of requests the service is receiving. (e.g., HTTP requests per second)
- Errors 💥: The rate of failed requests. All types of errors occurring in the system should be explicitly tracked.
- Saturation 🈵: A metric indicating how ‘full’ the service is. Measures the load on the system’s most constrained resources, such as CPU, memory, and disk space.
5. Let PromQL Handle Calculations: Keep Applications Simple 🧠
Do not perform complex calculations in your application code. There’s no need to calculate ratios like ‘requests per second’ and expose them as metrics.
- Application’s Role: Focus solely on exposing raw data. Simply increment a counter by 1 each time a request comes in. (http_requests_total.inc())
- PromQL’s Role: Use PromQL, a powerful query language, to perform all desired calculations, aggregations, and analyses, such as rate(http_requests_total[5m]).
Separating roles in this way simplifies application code, and the collected data can be utilized much more flexibly.
Conclusion
A great monitoring system starts with well-built observability, and the first step is to embed metrics correctly. Please remember the 5 best practices introduced today to build a stable and easy-to-analyze monitoring environment!
Tags: Prometheus, Monitoring, Instrumentation, Best Practices, SRE, DevOps, Observability, Cardinality
Leave a Reply