Hello! Today, I’d like to talk about Pushgateway, a useful tool in the Prometheus ecosystem for collecting metrics from short-lived jobs.
Pushgateway enables effective monitoring of data from targets with short lifespans, such as Cron Jobs and Batch Jobs, from which Prometheus finds it difficult to directly pull metrics. However, this convenient tool hides a pitfall we must be aware of: the problem of “stale metrics” or “zombie metrics.”
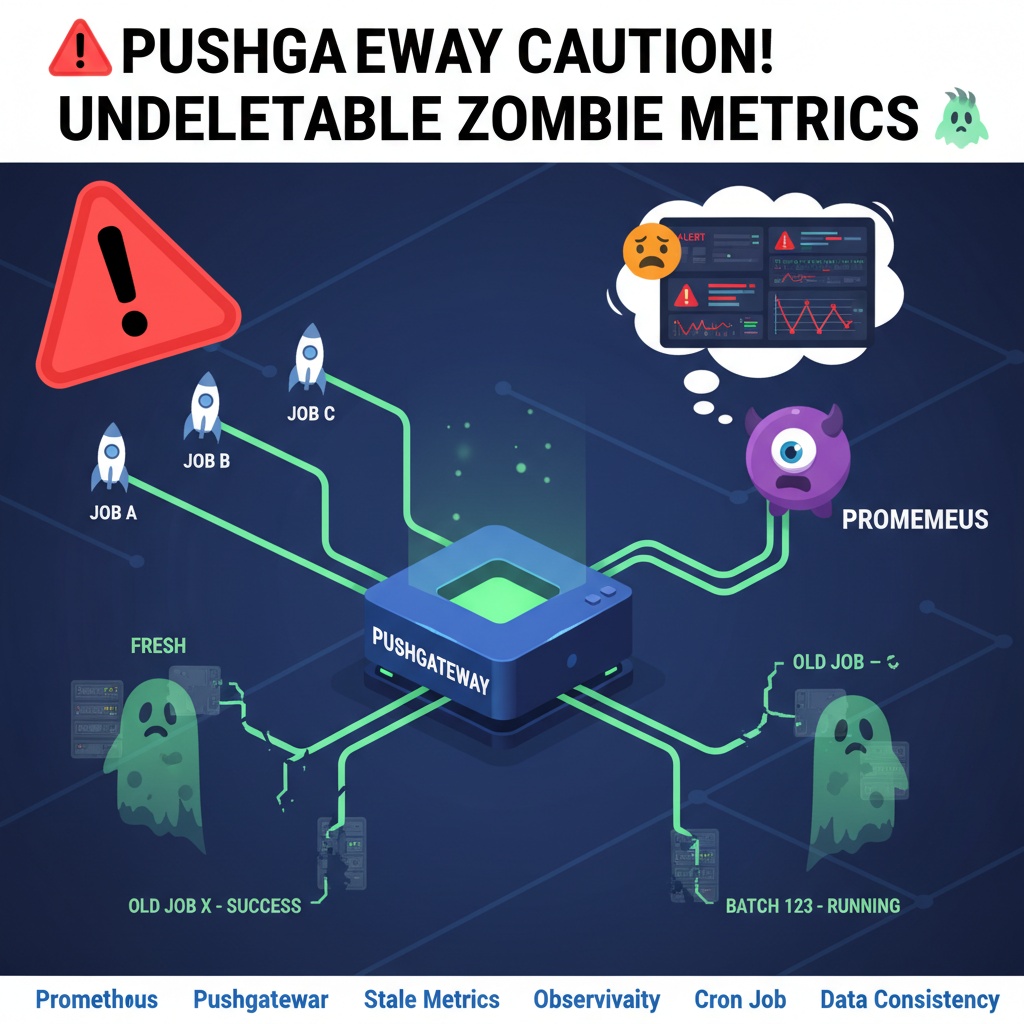
🤔 How does Pushgateway work?
The core operating principle of Pushgateway is like a ‘cache.’
- Job Start 🚀: A batch job or temporary job runs.
- Metric Transmission (Push) 📊: The job sends metrics about its status or results to Pushgateway.
- Metric Storage 📥: Pushgateway stores the received metrics internally.
- Prometheus Collection (Scrape) 🔍: Prometheus periodically scrapes the metrics stored in Pushgateway.
It seems perfect so far, right? But the problem arises after the job finishes.
🧟♂️ Why do Zombie Metrics appear?
Let’s assume a batch job successfully completes and terminates.
- Job: Execution ends ✅
- Pushgateway: Continues to store, saying “Job A’s last sent metric was this!” 📝
Pushgateway retains the last pushed metrics as they are. That is, it doesn’t recognize that the job which sent the metrics has disappeared. It’s like an old poster stuck on a wall even after the event is over. 📌
In this state, Prometheus continues to scrape Pushgateway, and Pushgateway continuously sends stale metrics from already terminated jobs to Prometheus. These metrics are what we call ‘zombie metrics.’
😱 Why are stale metrics a serious problem?
- Incorrect Data and Dashboards 📉 Data for jobs that no longer exist continues to be displayed on dashboards. This can lead to misjudgment of the system’s status. For example, a ‘last backup successful’ metric might continue to show ‘successful’ even if the data is three days old.
- False-Positive Alerts 🚨 This is the most critical issue. Prometheus evaluates alert rules based on stale metrics received from Pushgateway. If a “job failed” metric remains undeleted, you might continue to receive alert notifications for an issue that has already been resolved. This increases operator fatigue and delays response to genuine problems.
This is the most common and critical problem encountered when using Pushgateway.
✨ How can we solve this?
The solution is simple: “Clean up after yourself!”
After a job successfully completes, you must include logic to manually delete its metrics from Pushgateway.
Correct Job Flow:
- Job Start 🚀
- Metric Transmission 📊 (during job execution)
- Job Completion ✅
- Delete Metrics from Pushgateway 🗑️ (final step of the job script)
This way, Prometheus will no longer collect stale metrics, maintaining data consistency and preventing unnecessary alerts.
Conclusion
Pushgateway is undoubtedly a powerful tool for monitoring short-lived jobs. However, if its characteristics are not precisely understood and utilized, it can actually degrade the reliability of the entire monitoring system.
If you use Pushgateway, never forget to delete metrics after job completion! This small habit is truly important for a healthy monitoring environment. 😊
Leave a Reply