Many companies today are using a ‘hybrid’ strategy, keeping important data in internal data centers (on-premise) and developing new services in the cloud. 🏢☁️
It’s a great way to catch two birds with one stone: stability and flexibility! However, it creates an unspoken challenge for developers and operators: “When a failure occurs, the cause cannot be identified.”
Viewing on-premise server logs separately, and cloud dashboards separately… 😵 It’s like trying to understand the whole story by watching two different TV channels simultaneously. You must have felt frustrated not being able to see how the entire system is running at a glance.
Today, we will explore strategies to solve this problem and achieve ‘Observability’ to transparently look into our systems.
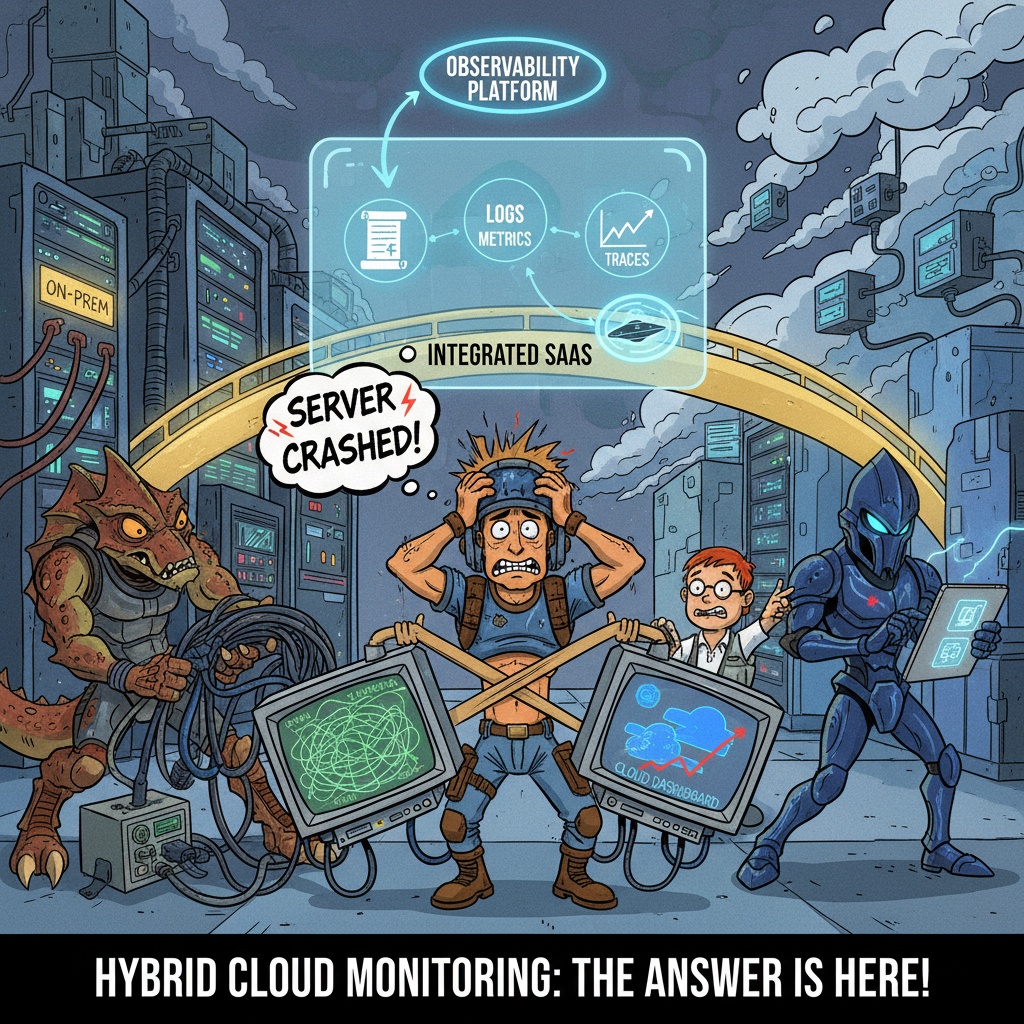
🤔 Common Pitfalls We Often Fall Into
While we review various tools to solve problems, a wrong choice can actually worsen the situation. Let’s first look at three common pitfalls.
1️⃣ Pitfall: “Just collecting logs will be enough, right?” (Single-purpose logging service)
This is the most basic approach: collecting all logs that the system outputs into one place. 📜
Of course, logs are important. They tell us the record of specific events, such as “what error occurred.” However, this alone is not enough.
- Limitation: Logs do not directly show the system’s
health
or performance. For example, you cannot know information like “CPU usage is nearing 90%” (metric) or “a single user request is delayed by 5 seconds in the DB” (trace).
⚽️ Analogy: It’s like only knowing the final score (logs) in a soccer game. You wouldn’t know who scored, what the possession rate was (metrics), or what passes led to the goal (traces).
2️⃣ Pitfall: “Because it’s the latest technology!” (Cloud-native exclusive platform)
There are many excellent monitoring tools for cloud-native environments like Kubernetes and serverless. 🚀 However, we still have the important ‘on-premise’ environment.
- Limitation: While these tools excel at collecting cloud environment data, they often do not support legacy servers in internal data centers at all. Consequently, on-premise remains a ‘black box’ where the cause of issues cannot be identified. ⬛
🏡 Analogy: It’s like installing a state-of-the-art smart home security system, but only putting cameras in the newly built annex while leaving the important main building unprotected. It’s half-baked security.
3️⃣ Pitfall: “Let’s build it ourselves!” (Open source requiring manual scaling)
“If we build it ourselves with open source, we can save costs and customize it to our liking!” 🔧 This sounds very appealing, but hidden costs are involved.
- Limitation: Operating open-source tools stably requires dedicated personnel. As the service grows, manual scaling is needed, and operational burdens such as security patches, version management, and incident response increase exponentially. Especially for systems where security and compliance are critical, guaranteeing the stability of a self-built system can be difficult.
🏭 Analogy: It’s like building a small power plant yourself to generate electricity for your home. It’s possible, but from the perspective of stability, maintenance, and cost, using a professional power company’s service (SaaS) is much more efficient.
✨ The Answer: All in One! Integrated SaaS Observability Platform
So, what’s the answer? It’s using a SaaS-based observability platform that can universally collect telemetry data from both on-premise and cloud environments.
That sounds a bit complex, right? Let’s break it down into three keywords.
- SaaS (Software as a Service) ✅
- We don’t need to worry about platform installation, scaling, or maintenance. A specialized company handles all of that. We just need to send our system’s data and focus on analysis. Operational resources are dramatically reduced.
- Observability Platform ✅
- It doesn’t just show logs, metrics, and traces separately. It organically connects these three types of data. For example, it allows you to understand at once “what error (log) occurred at the time of a CPU usage spike (metric), and which user’s request (trace) initiated this error.”
- Universal Data Capture ✅
- This is the core. Through agents provided by the platform or standard protocols (e.g., OpenTelemetry), data can be collected anywhere. All data, from old physical servers, virtual machines (VMs), containers, to serverless functions, can be gathered in one place regardless of the environment.
How is this possible? (Simple Example)
Typically, these platforms operate by installing lightweight agents that collect data. For example, let’s look at a configuration file for the OpenTelemetry Collector, which has become a standard recently.
With just this one configuration file, you can collect log files from on-premise servers and data from cloud apps, sending it all to a single SaaS platform.
Code Example: otel-collector-config.yaml
# OpenTelemetry Collector Configuration Example
receivers:
  # Receive data from cloud-native apps (standard protocol)
  otlp:
    protocols:
      grpc:
      http:

  # Read log files from on-premise servers
  filelog:
    include: [ /var/log/my_onprem_app.log ]
    start_at: beginning

processors:
  batch:

exporters:
  # Send all collected data to 'MySaaSPlatform'
  otlphttp:
    endpoint: "https://api.my-saas-platform.com/v1/metrics"
    headers:
      "api-key": "YOUR_API_KEY" # SaaS platform authentication key

service:
  pipelines:
    # Metrics/Traces pipeline
    traces:
      receivers: [otlp]
      processors: [batch]
      exporters: [otlphttp]
    # Logs pipeline
    logs:
      receivers: [filelog]
      processors: [batch]
      exporters: [otlphttp]
Example of Collected Raw Data
The data collected in this way will each have its own context.
// Example 1: Logs collected from an on-premise server
{
  "timestamp": "2025-11-06T08:29:00Z",
  "level": "ERROR",
  "message": "Legacy DB connection timeout",
  "attributes": {
    "service.name": "auth-service-onprem",
    "host.name": "idc-server-01"
  }
}

// Example 2: Metrics collected from a cloud container (Prometheus format)
http_requests_total{service="payment-service-cloud", pod_name="payment-xyz-123", code="503"} 5

// Example 3: Trace data (Span) spanning cloud-on-premise
{
  "traceId": "a1b2c3d4",
  "spanId": "span-002",
  "parentSpanId": "span-001",
  "name": "SELECT user FROM legacy_db",
  "service": "auth-service-onprem",
  "duration_ms": 2500
}
The data collected in this way will be combined and displayed on the SaaS platform’s dashboard. Developers no longer need to wander through multiple systems; they can grasp the entire system’s flow and status from a single location. 🚀
Conclusion
The complexity of hybrid environments will only increase in the future. To maintain system stability and business continuity in such environments, securing ‘the ability to see the entire system at a glance,’ in other words, integrated observability, is essential.
With fragmented tools or solutions dependent on specific environments, it’s difficult to find the root cause of complex problems. How transparent is your system right now? 🤔
Leave a Reply