Every developer, at some point, experiences building a monitoring system to understand the state of their application. Among the most frequently mentioned tools for this is OpenTelemetry (OTel). However, when you actually try to use OTel Metrics, unfamiliar terms like MeterProvider, Meter, Instrument, and MeterReader can be confusing. 😵
If you’ve ever thought, “What are all these things?” or “Why is it so complicated?”, then this article is for you. We’ll clearly and easily break down why each element is needed and how they work together organically, using an analogy of a car parts factory! 🚗
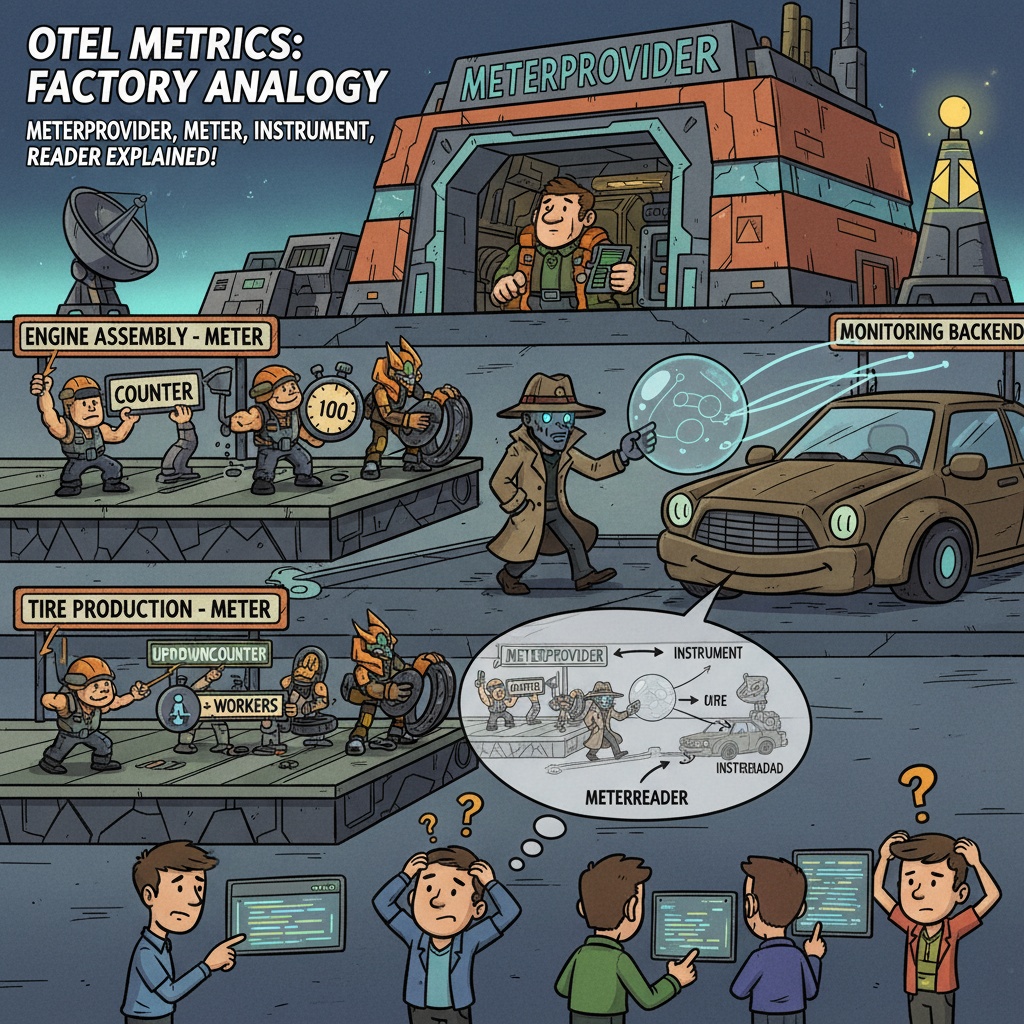
🏭 Understanding Instantly with a Car Factory Analogy
Let’s compare the complex structure of OpenTelemetry Metrics to a giant ‘car parts factory’.
- MeterProvider (Entire Factory Building 🏛️): This is the top-level management system that oversees everything in the factory. It’s responsible for the factory’s overall rules and settings, such as what parts (data) to produce and where to send the finished parts (export). It’s a single, massive control tower for the entire application.
- Meter (Specific Production Line 👩🔧): This is a production line with a specific purpose within the factory, like an ‘engine assembly line’ or a ‘tire production line’. Each line has a unique name, such as com.my-service.engine-assembly. This name clearly tells us, “Which line produced this part?”
- Instrument (Measurement Tool 📊): These are the specific measurement devices used on each production line.
- Counter: A ‘counter’ 🔢 that counts the total number of engines produced.
- Histogram: A ‘stopwatch’ ⏱️ that measures the time taken for engine assembly and records its distribution.
- UpDownCounter: The ‘number of workers’ 👩🏭👨🏭 currently working on the line (can increase or decrease).
- MeterReader (Quality Control (QC) Manager 🕵️): This is a quality control manager who regularly inspects the entire factory. This manager tours all production lines every minute, meticulously collecting and reading the values from each measurement tool (Instrument), and then submits a report to headquarters (the monitoring backend). The important point is that field workers (developers) do not directly call the QC manager. They are pre-assigned during factory setup (MeterProvider configuration) and automatically perform their duties.
Just remembering this analogy should help you visualize the role of each component! Now, let’s dive a little deeper.
🧩 Detailed Roles and Characteristics of Each Component
1. MeterProvider: The Starting Point and Overall Manager of Everything 🏛️
MeterProvider is the top-level entry point for metric collection activities.
- Role: Manages the entire lifecycle and configuration of the metrics SDK.
- Characteristics:
- ✅ It is common to create only one MeterProvider instance per application (singleton pattern). Creating multiple can lead to configuration conflicts and fragmented data.
- It sets global information (Resource) such as the application’s name (service.name) and version (service.version).
- It configures the entire pipeline, including which MeterReader to use for data collection and which Exporter to use for sending data externally.
- It is the sole channel for creating and providing Meter instances.
2. Meter: A Namespace for Grouping Metrics 🏷️
Think of this as the process of obtaining a specific production line within the giant MeterProvider factory.
- Role: It is a factory for creating Instruments and a group (Namespace) that logically bundles related metrics.
- Characteristics:
- ✅ You must specify a unique name and version. (e.g., io.opentelemetry.contrib.spring-webmvc, 1.32.0)
- Why is the name important? 🧐 This name allows you to clearly distinguish whether “this metric came from my business logic or from an external library I used (e.g., Spring, MongoDB Driver)?” This provides tremendous flexibility when filtering metrics or building dashboards later.
3. Instrument: The Tool for Recording Actual Data ✍️
This is the stage where actual measurement equipment is used on the production line. It’s the part developers interact with most in their code.
- Role: An object that records actual measured values.
- Types and Usage Examples:
- Counter: Records a cumulative value that only increases.
- Example: Total number of HTTP requests processed, total number of errors occurred.
- httpRequestCounter.add(1)
- UpDownCounter: Records a value that can both increase and decrease.
- Example: Number of currently active sessions, number of messages in a pending queue.
- activeUsersCounter.add(1) / activeUsersCounter.add(-1)
- Histogram: Records the distribution (min, max, average, percentiles, etc.) of values.
- Example: API request processing latency, message payload size.
- requestLatencyHistogram.record(127.5)
- Observable Gauge: Registers a callback function to measure a value at a specific point in time. The SDK periodically calls this function to retrieve the value.
- Example: Current CPU utilization, JVM heap memory usage.
- meter.gaugeBuilder(“jvm.heap.usage”).buildWithCallback(measurement -> measurement.record(getHeapUsage()))
4. MeterReader: The Unseen Collector at Work 🕵️
MeterReader is not something developers directly call in their code. However, it plays a crucial role in the metrics pipeline.
- Role: An automated component that periodically reads accumulated metric data within the SDK and forwards it to the Exporter.
- Characteristics:
- It is registered when configuring the MeterProvider. Developers only need to configure, “Please have the factory’s QC run every minute.”
- PeriodicExportingMetricReader is most commonly used, collecting and exporting data at specified intervals (e.g., 60 seconds).
- It plays an important role in determining the data aggregation method (Aggregation Temporality: Delta vs Cumulative).
🌊 Overview of the Entire Process
Now, let’s put all the pieces together and summarize the entire flow.
- [Step 1] Configuration (At application startup)
- Create a MeterProvider only once.
- Configure Resource information (service name, etc.) here.
- Register PeriodicExportingMetricReader and OTLPMetricExporter (for sending data) to complete the pipeline.
`
// 1. Configure Exporter and Reader
OtlpGrpcMetricExporter metricExporter = OtlpGrpcMetricExporter.builder().build();
PeriodicExportingMetricReader metricReader = PeriodicExportingMetricReader.builder(metricExporter)
.setInterval(Duration.ofSeconds(60)) // Collect every 60 seconds
.build();
// 2. Configure Resource information
Resource resource = Resource.getDefault().toBuilder()
.put(ResourceAttributes.SERVICE_NAME, “my-awesome-service”)
.build();
// 3. Create and register MeterProvider
SdkMeterProvider meterProvider = SdkMeterProvider.builder()
.setResource(resource)
.registerMetricReader(metricReader)
.build();
// Set globally in OpenTelemetry SDK (usually handled by auto-configuration)
OpenTelemetrySdk.builder().setMeterProvider(meterProvider).buildAndRegisterGlobal();
`
- [Step 2] Instrumentation (Within business logic code)
- Obtain a Meter from the configured global MeterProvider. (by library/class name)
- Use the obtained Meter to create the necessary Instrument (e.g., Counter).
- Record values by calling the Instrument’s method whenever a specific event occurs, such as request processing or error occurrence.
`
// Get Meter
Meter meter = GlobalOpenTelemetry.getMeter(“com.mycompany.my-awesome-service”);
// Create Instrument
LongCounter httpRequestCounter = meter.counterBuilder(“http.requests.total”)
.setDescription(“Total number of HTTP requests”)
.setUnit(“1”)
.build();
// Record value when an event occurs
public void handleRequest(Request request) {
// … business logic …
httpRequestCounter.add(1, Attributes.of(stringKey(“http.method”), “GET”, longKey(“http.status_code”), 200L));
}
`
- [Step 3] Collection and Export (Automatic operation within SDK)
- In the background, the MeterReader (QC manager) wakes up at the configured interval (e.g., 60 seconds).
- It collects and aggregates the values recorded by all Instruments.
- The collected data is passed to the Exporter.
- The Exporter sends this data to a monitoring backend like OTel Collector, Prometheus, or Datadog. 🚀
🚫 Correcting Common Misconceptions and Mistakes
- “Do I need to create a MeterProvider for every class?”
- No! 🙅♂️ MeterProvider holds the configuration for the entire application, so you must share a single instance. Creating multiple will fragment metric data, making proper monitoring impossible.
- “Can I use any name for the Meter?”
- No! 🙅♂️ The Meter’s name is a crucial identifier that clarifies the origin of the metric. Instead of ambiguous names like my-meter, use clear and structured names like com.my-library.billing to facilitate filtering and analyzing data later.
- “Do I need to directly call MeterReader when sending data?”
- No! 🙅♂️ MeterReader is an automated component that the SDK automatically runs periodically once it’s registered during the configuration phase. Developers do not need to control it directly in their instrumentation code.
Conclusion
Are the relationships between MeterProvider, Meter, Instrument, and MeterReader now clear? These four elements each fulfill their roles and together form a powerful and flexible metrics system.
- By setting the overall stage with MeterProvider,
- By clarifying the origin with Meter,
- By measuring desired data with Instrument, and
- By understanding this flow where MeterReader automatically collects/reports, you too can become an expert in utilizing OpenTelemetry Metrics 100%.
Now, confidently embed powerful observability into your applications! ✨
Leave a Reply