When a service suddenly slows down or an unknown error occurs… it’s a dizzying moment every developer has experienced at least once. 😩 Often, even after digging through log files and checking server specifications, no clear cause is visible. Is it a CPU issue? Network latency? Or perhaps strange behavior from a specific user?
The answer to all these questions lies in comprehensively examining the various signals sent by the system, namely telemetry data. However, these data are so numerous and disparate that it’s often daunting to know where to start.
Today, we’ll clearly organize these complex intertwined data and explore how to gain insight into them all at once using a powerful tool called OpenTelemetry (Otel). No more debugging based on guesswork! 🙅♂️ Let’s dig into the core of the problem with data.
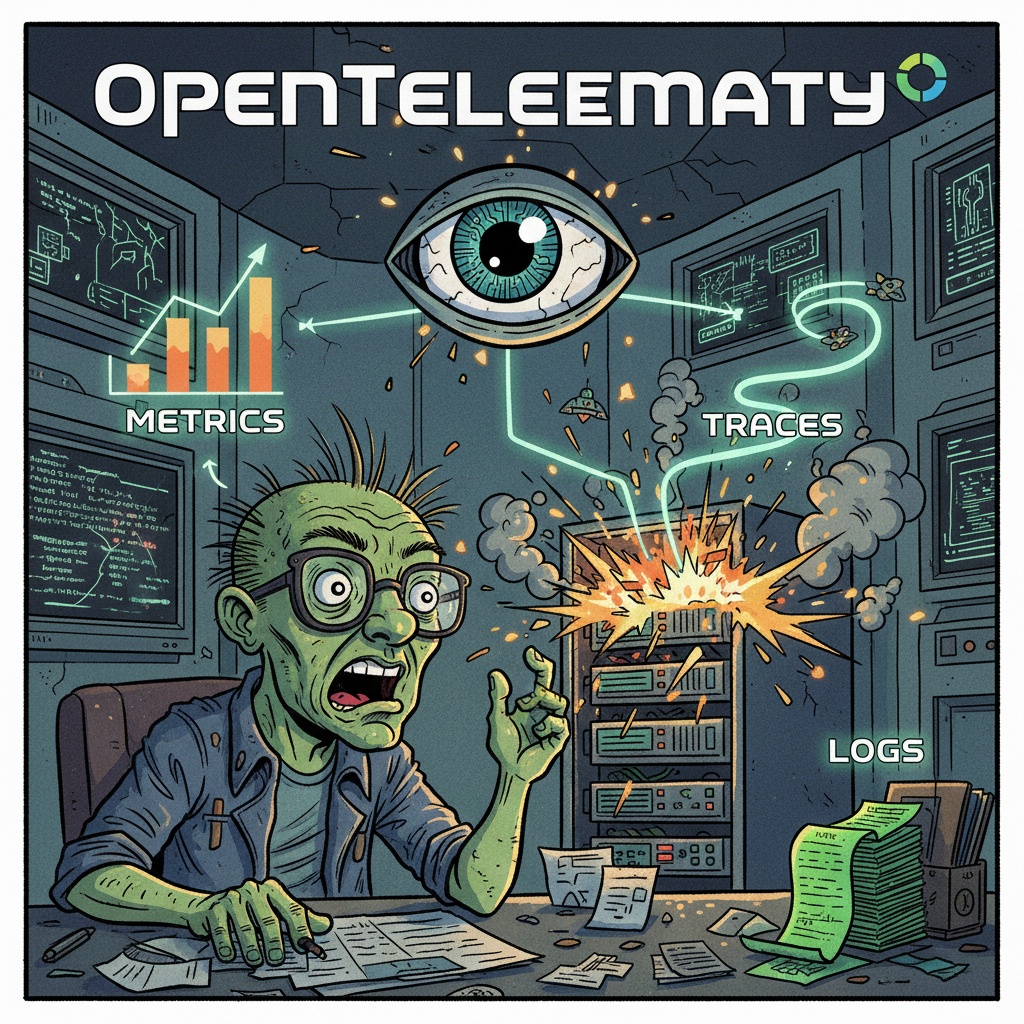
🗺️ Seeing the Whole Picture: The Three Pillars of Observability
Before diving into individual data points, it’s crucial to understand the overall context. In the world of modern system monitoring, or Observability, all telemetry data is broadly categorized into three core types: Metrics, Traces, and Logs.
1. Metrics 📊
- What are they?: These are numerical values representing the system’s state at a specific point in time. They are indicators that allow you to grasp at a glance how the system changes over time. Think of a car’s dashboard (speed, RPM, fuel level).
- When to use them?: Used to understand the overall health or trends of a system, such as “CPU usage exceeded 90%,” or “Request volume doubled in the last hour!”
2. Traces 🗺️
- What are they?: This is a record of the entire journey of a single user request, from when it enters our system, passes through various microservices, and exits as a response. Like package tracking, it shows where the request started, which services it passed through, and how long each step took.
- When to use them?: Essential for analyzing inter-service dependencies and finding bottlenecks in a distributed environment, such as “Service A is particularly slow when calling Service B,” or “At what stage is the payment request failing?”
3. Logs 📝
- What are they?: These are detailed text records left when a specific event occurs. Like an airplane’s black box, they provide the most specific context about what happened.
- When to use them?: Used to analyze the cause of specific errors or check audit records, such as “NullPointerException occurred on line XX!” or “User ID ‘testuser’ just successfully logged in.”
These three are not competing but complementary. You discover anomalies (e.g., a sudden increase in error rate) with Metrics, narrow down which service and request caused the problem with Traces, and then understand the detailed context of that request with Logs to fix the bug.
🤔 So, Where Does My Data Fit? (feat. OpenTelemetry)
Now, let’s find out which of these three pillars the data we commonly encounter belongs to, and how OpenTelemetry collects them.
To put it simply, OpenTelemetry is a project born to collect and standardize all this data.
A. IT Infrastructure Telemetry (CPU, Memory, Disk, etc.)
- Main Type: Metrics 📈
- Description: “Server CPU usage 80%”, “Memory remaining 500MB”, etc., are the most representative numerical indicators of system health. Therefore, they clearly fall under metrics.
- In OpenTelemetry?: This is easily solved using a data collection agent called Otel Collector. By simply enabling the hostmetrics receiver, you can automatically collect core OS-level metrics.Example of collected Raw Data (Prometheus format)
- system_cpu_utilization{state=”idle”} 0.85 system_memory_usage{state=”used”} 1283457024
- # Otel Collector configuration example receivers: hostmetrics: collection_interval: 1m scrapers: cpu: memory: disk: network:
B. Network Telemetry (Requests/Responses, Latency, etc.)
- Main Types: Metrics, Traces 🌐
- Description: Data like “API average response time 200ms” and “5xx error rate 5%” are metrics. However, the “process of Service A calling Service B” itself shows the journey of a request, making it a core element of a trace.
- Incorrect Approach: Simply logging network calls as “call success/failure” misses the overall flow. To properly analyze bottlenecks, you need to see which part of the entire transaction this call is through traces.
- In OpenTelemetry?: Installing the Otel SDK in your application automatically instruments commonly used HTTP clients and web frameworks. This ensures that all inter-service network calls are automatically recorded as part of a Trace (Span), and related Metrics (latency, request size, etc.) are also generated.
C. User Telemetry (Clicks, Page Views, User Actions, etc.)
- Main Types: Logs, Events within Traces 🧑💻
- Description: A record like “User A clicked the ‘Buy’ button” can be seen as a log containing detailed context. At the same time, this click event becomes an important event that forms part of the overall user journey (Trace) leading from “product view → add to cart → purchase.”
- In OpenTelemetry?: You can collect user interactions using the Otel SDK for browsers or mobile apps (Real User Monitoring, RUM area).
D. Application Infrastructure Telemetry (DB Queries, Function Calls, etc.)
- Main Types: Traces, Metrics, Logs 💻
- Description: This area includes all three of the above, making it the most comprehensive data. How long a specific function took (Span of a Trace), cache hit rate (Metric), and what errors occurred inside the function (Log) all fall under application telemetry.
- In OpenTelemetry?: Developers can directly trace specific parts of their code using the manual instrumentation feature of the Otel SDK.
`
from opentelemetry import trace
Get the current Trace Context
tracer = trace.get_tracer(name)
Create a new Span (unit of work) named “process_order”
with tracer.start_as_current_span(“process_order”) as span:
Add useful information (Attribute) to this Span
span.set_attribute(“order_id”, “12345”)
… Order processing logic …
print(“Processing order…”)
Add an event to the Span
span.add_event(“Inventory check complete”)
… Additional logic …
`
- Code Example (Python Manual Instrumentation)
✨ Conclusion: Weaving Disparate Data into a Single Story
The content we’ve explored so far can be summarized in the following table:
| Data Type | Core Telemetry Type | OpenTelemetry Collection Method |
| A. IT Infrastructure | Metrics | Otel Collector (hostmetrics receiver) |
| B. Network | Metrics, Traces | Otel SDK (Auto-Instrumentation) |
| C. User Behavior | Logs, Traces (Events) | Otel SDK for Web/Mobile (RUM) |
| D. Application | Traces, Metrics, Logs | Otel SDK (Auto/Manual Instrumentation) |
Now, let’s return to our initial question. When an unknown failure occurs, we no longer need to stumble in the dark.
By looking at the system’s metrics, traces, and logs together through the standardized window of OpenTelemetry, all data, from the smallest tremor in the infrastructure to a single user click, connects to form one grand narrative.
You will experience the moment when scattered dots connect into lines, and the true cause of the problem reveals itself. 🚀
Leave a Reply