Hello, developers and DevOps engineers! In an MSA (Microservices Architecture) environment, how do you manage the vast amounts of logs, metrics, and trace data pouring out from countless applications? 🤔 Many of you are probably overwhelmed by the sheer volume of data or struggling to integrate data in different formats.
The standard that emerged to solve these problems is OpenTelemetry (OTel). And at the heart of the OTel ecosystem, controlling the data flow, is a powerful component: the OpenTelemetry Collector.
Today, we will delve into what this Collector is, and specifically, how it aggregates and processes data.
❓ What is the OpenTelemetry Collector?
To put it simply, the Collector is like a specialized post office for telemetry data 📫. It receives letters (data) sent from various places (applications), sorts them (processes), and delivers them to their final destination (monitoring backend).
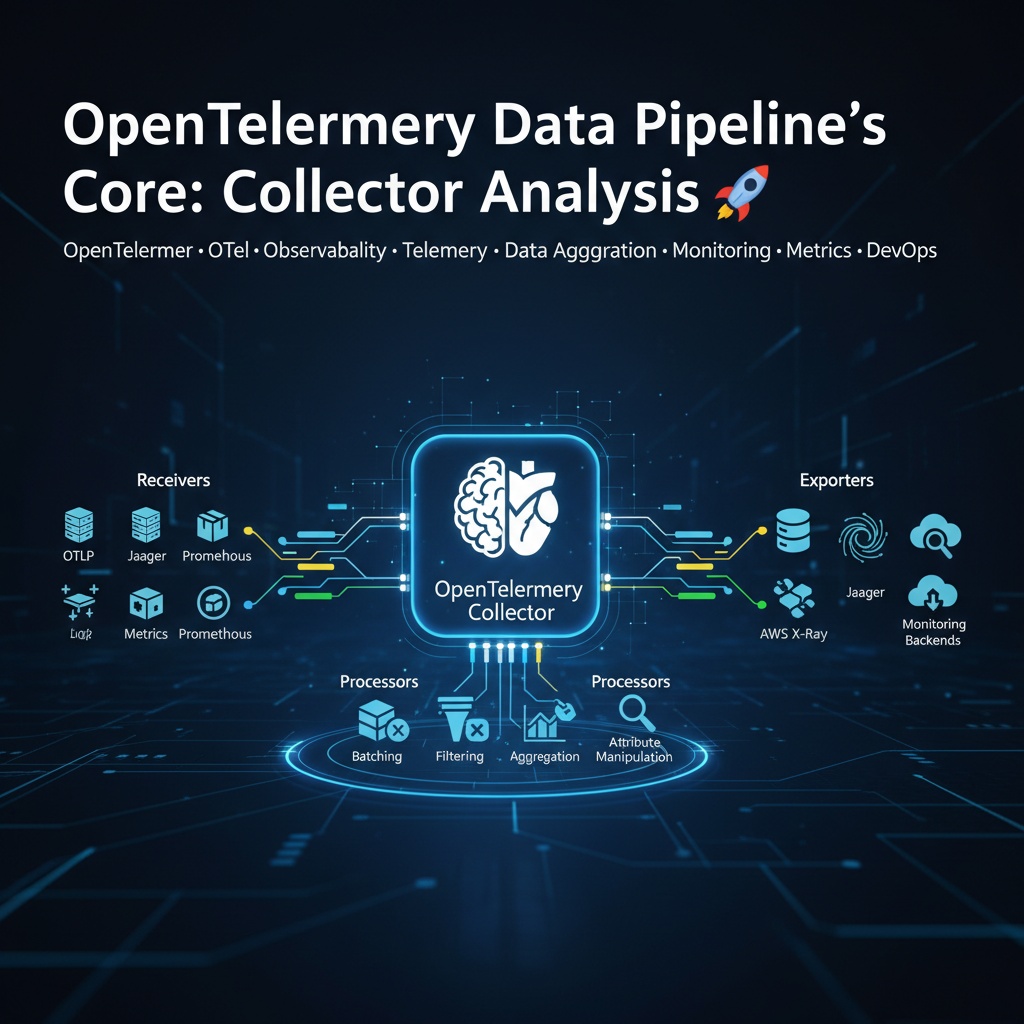
The Collector is a vendor-agnostic, independent service that goes through three core pipeline stages:
- Receivers 📥: This part receives telemetry data in various formats (OTLP, Jaeger, Prometheus, etc.). It defines which protocols will be used to receive data.
- Processors ⚙️: The most powerful feature of the Collector lies in this stage. It’s the process of transforming received data before exporting it.
- Exporters 📤: This sends the processed data to the final backend (Jaeger, Prometheus, AWS X-Ray, etc.) for storage and analysis.
✨ The Wizard of Data Aggregation and Processing: Processors
The core of the question, “What component defines the data aggregation method?” lies precisely in this Processing stage. The Collector can perform various operations on data via Processors before sending it to the backend.
Key processing operations include:
- Batching: Instead of sending data one by one, it collects a certain amount or for a certain period and sends it all at once. This significantly reduces network overhead. It’s like collecting items for efficient parcel delivery and sending them all at once in a large truck. 🚚
- Filtering: Removes unnecessary data. For example, trace requests for /health checks that verify system status might not be very meaningful for analysis, so they can be excluded. 📜 -> 🗑️
- Aggregation: Summarizes multiple data points to create new metrics. For instance, hundreds of request success/failure metrics arriving every second can be aggregated into meaningful indicators like “requests per minute success rate.”
- Attribute Manipulation: Adds additional context information to data. For example, adding attributes like environment: production or k8s.cluster.name: my-cluster to all spans makes it easier to filter and analyze data later.
📝 Example Collector Configuration File (config.yaml)
Let’s look at how these processes are configured through code. Below is a simple Collector configuration that receives data via OTLP, processes it in batches, and then outputs it as console logs.
# config.yaml

# 1. Defines how data will be received.
receivers:
  otlp:
    protocols:
      grpc:
      http:

# 2. Defines how data will be processed. (Key!)
processors:
  batch:
    # Batches data every 200ms or when 100 spans accumulate.
    timeout: 200ms
    send_batch_size: 100
  memory_limiter:
    # Limits the maximum memory used by the Collector to enhance stability.
    check_interval: 1s
    limit_mib: 4000

# 3. Defines where the processed data will be sent.
exporters:
  logging:
    # Outputs to the console as logs for easy debugging.
    loglevel: debug

# 4. Connects the above components into a pipeline.
service:
  pipelines:
    traces: # Trace data pipeline
      receivers: [otlp]
      processors: [memory_limiter, batch]
      exporters: [logging]
    metrics: # Metric data pipeline
      receivers: [otlp]
      processors: [memory_limiter, batch]
      exporters: [logging]
In the above configuration, looking at the service.pipelines.traces section, you can clearly see the data flow.
Data received by the otlp receiver -> goes through memory_limiter and batch processors -> and is then sent to the logging exporter component. Thus, the entity that defines processing methods like data aggregation (batching) is the Collector’s configuration file.
🤔 Why are other components not the answer?
Comparing the Collector’s role with other elements of the OpenTelemetry ecosystem makes its function even clearer.
1. SDK (Software Development Kit)
- Role: A library installed within application code to
generate (instrumentation) telemetry data. 👩💻
- Why not?: The SDK is at the very point where data originates. While simple sampling or basic attribute addition is possible, it’s not suitable for centrally aggregating data from multiple services or applying complex routing rules. The SDK’s role is focused on data generation, while the Collector focuses on central processing and management of generated data.
2. Exporters (Export Components)
- Role: Responsible for transmitting data in a format specific to a particular backend. 📤
- Why not?: The Exporter is responsible for the very last stage of the pipeline. It merely acts as a ‘delivery person’ sending data to its final destination and does not include logic for processing or aggregating data in the middle. Data processing is already completed in the Processor stage.
🌟 Conclusion: The Importance of the Collector in the Overall Context
When building an Observability system using OpenTelemetry, the Collector is not just a proxy that forwards data.
The Collector is the brain 🧠 and heart ❤️ of the telemetry data pipeline.
Applications can focus solely on data generation via the SDK, delegating all complexity of data processing and transmission to the Collector. This offers the following benefits:
- Separation of Concerns: Application code can focus solely on business logic.
- Flexibility and Scalability: When adding new monitoring backends or changing data processing rules, you only need to modify the Collector configuration without redeploying the application.
- Performance Optimization: Reduces network traffic and backend load through batch processing, etc.
- Data Standardization: Can refine data from multiple sources into a consistent format before sending it to the backend.
Therefore, if you want to define how telemetry data is processed, including aggregation, filtering, and enrichment, the answer lies in the OpenTelemetry Collector.
Leave a Reply