AIOps stands for Artificial Intelligence for IT Operations, an approach that uses AI to assist in the analysis and response to IT operational data. It can be used to group alerts, identify potential root causes, or execute predefined actions. However, “this looks abnormal,” “this could be the cause,” and “it’s safe to change this now” are distinct judgments.
Let’s say a shopping mall API is slowing down and database connection utilization has increased. While it’s useful for AI to connect and explain these two, simply restarting the DB or unconditionally scaling up the application based solely on that explanation could exacerbate the problem. What’s needed is an operational design that links observations to evidence and restricts executable actions with separate approval, authorization, and recovery conditions.
This article outlines these boundaries based on AWS’s AIOps explanation and Google SRE’s monitoring principles, as confirmed on October 15, 2026. The shopping mall and all metrics, times, and settings are synthetic examples for illustrative purposes and do not represent actual implementation experience or disaster recovery performance.

Featured image: AI-generated conceptual diagram. It does not reproduce actual dashboards or service configurations.
1. First, Separate Observation, Root Cause Candidates, and Execution Decisions
AWS describes AIOps as an approach that enhances operational efficiency by analyzing data from various sources, and it introduces a flow of observation, expert judgment and collaboration, and action. Since machine learning and natural language processing can be utilized, it doesn’t necessarily mean attaching a single conversational language model. AWS AIOps Overview
When applying this in operations, it’s better to interpret this flow as three stages with different levels of authority. The first stage is to gather what is happening now. The second is to compare which explanation best describes the observations. The third is to change the actual system based on that explanation.
For example, “P95 latency for product queries has increased” is an observation. P95 is the value at approximately the 95th percentile when request latencies are ordered from smallest to largest, indicating the state of slower requests. “DB connection contention might have contributed to the latency” is a root cause candidate. “Revert the previous change” is a proposed action. Even if the observation is correct, the candidate might be wrong, and even if the candidate is correct, the conclusion that the action is safe must be verified separately.
If the previous OTel and LGTM article explained how to connect data, this article focuses on what evidence to use to link connected information to action. Clearly defining the point at which judgment transitions is the starting point, rather than rebuilding the collection structure.
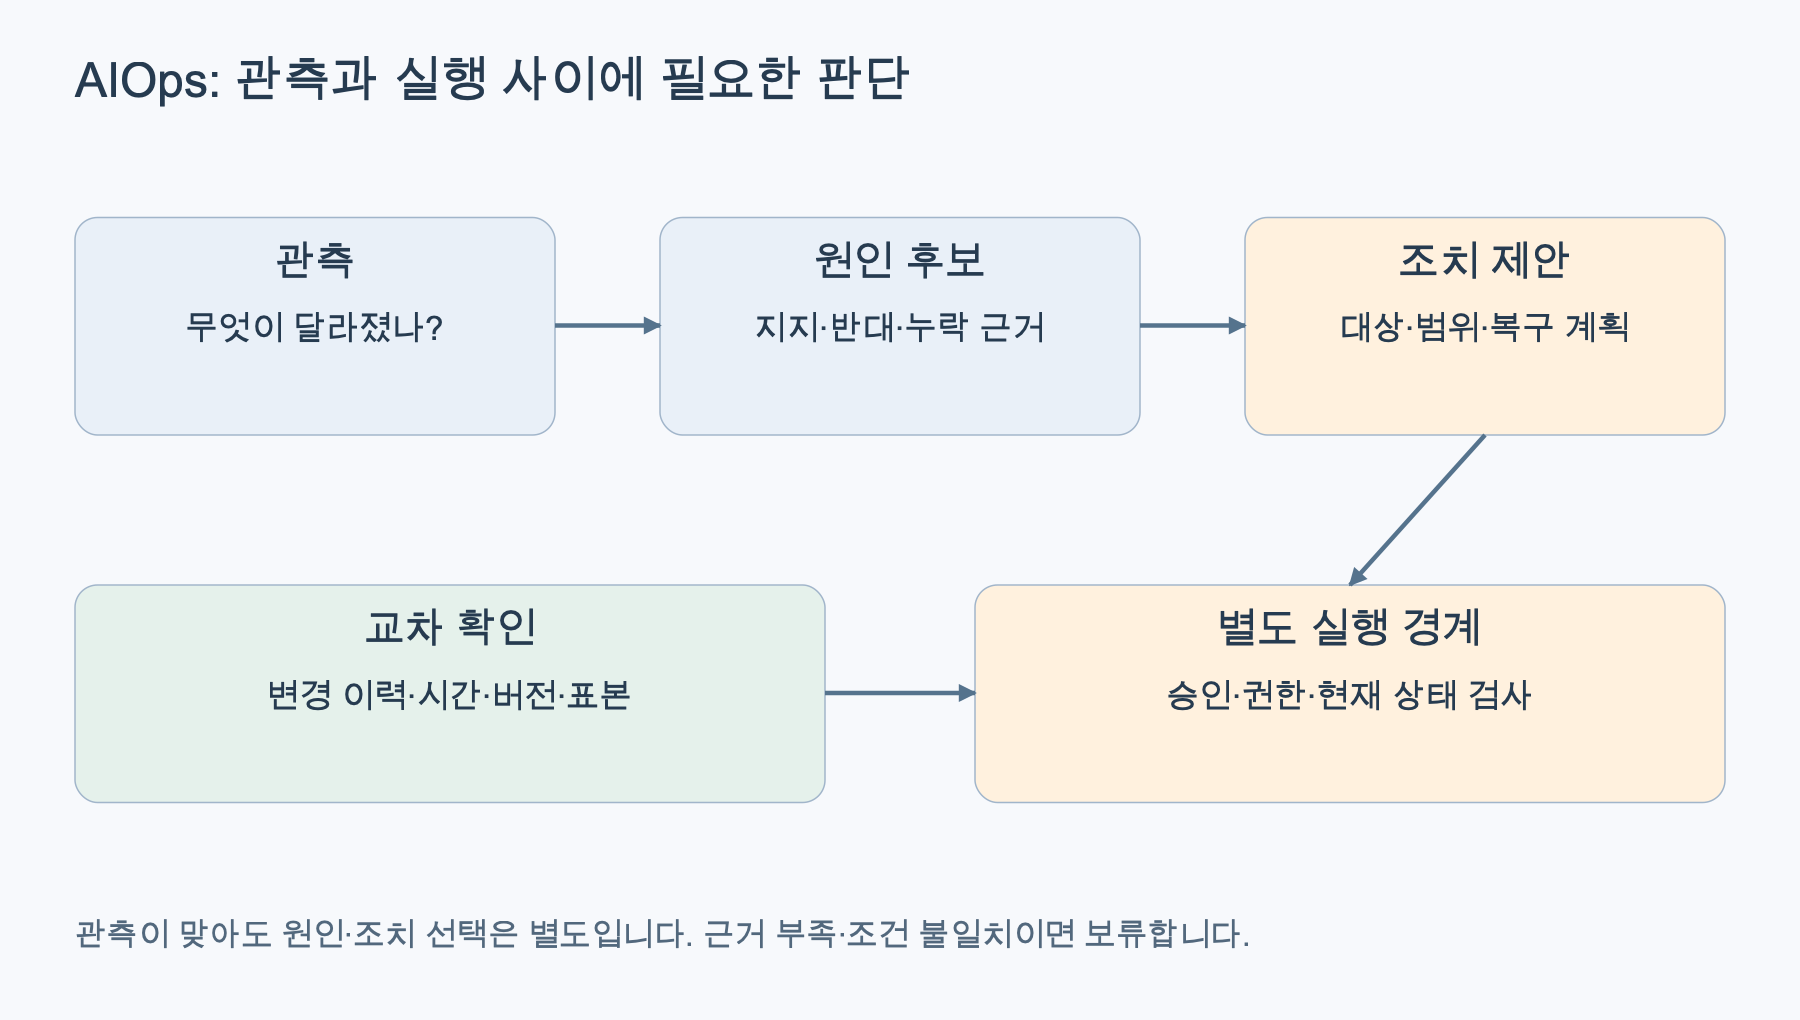
Figure 1. Conceptual diagram distinguishing observation, candidate review, and action into stages with different authorities. Reconstructed based on official documents such as AWS AIOps Overview and Google SRE Monitoring. Root cause candidates are not automatically approved for execution.
2. Logs, Metrics, and Traces Answer Different Questions
Logs show events at specific points in time, metrics show values and distributions over a period, and traces show the path a request takes through multiple processing stages. By looking at these three types of data together, you can narrow down which requests and components are connected to changes within the same timeframe. However, each data type has different aggregation times, sample ranges, and potential record omissions.
Let’s assume the following changes were observed in a hypothetical product query API. Each value was generated for comparison intervals of the same length and does not represent recommended thresholds for a specific service.
| Check Item | Previous Interval | Interval with Increased Latency | Next Question |
|---|---|---|---|
| Successful Request P95 Latency | 180ms | 900ms | Increased in which path and deployment version? |
| External API Request Volume | 300 per second | 310 per second | Can the change be explained by user demand alone? |
| DB Connection Utilization | 45% | 90% | Are the connection limits/measurement targets the same? |
| Connection Acquisition Wait | Almost none | Wait increased | Which app instance is waiting? |
| DB CPU Utilization | 35% | 40% | Are there lock/I/O/connection constraints other than CPU? |
| Change History | Retry 1 time setting | Retry 3 times setting deployment | Has the number of DB call attempts for that path increased? |
DB connection utilization, you need to check what the denominator is. Its meaning changes depending on whether it’s based on the allowed number of connections for the DB server or the upper limit of the application’s connection pool. Looking only at the service-wide average might cause you to miss waiting times for specific instances.
In this example, traces are used to separate and view the intervals where product queries wait for connections and where they execute queries. In logs, we look for retry and connection wait-related events for the same deployment version. Instead of sending raw logs entirely to the model, we define the data scope to provide aggregated data with identifying information removed and only the necessary intervals.
Google SRE presents latency, traffic, errors, and saturation from a user’s perspective as important signals. Instead of just looking at average latency, you should distinguish between successful and failed request latencies and also observe how saturated resources are. Distinguishing Symptoms from Causes
In the synthetic example, there are several possible explanations. Increased retries might have boosted DB request volume, or long transactions might have held connections for extended periods. There’s also a possibility of connection release issues or network latency occurring simultaneously. The observation that DB CPU didn’t significantly rise only weakens the explanation of CPU shortage; it’s not proof that the entire DB is normal.
For AI, it’s more useful to have it organize evidence for each candidate rather than just providing a single conclusion. For example, you could request it as follows. The statement below is an example written for analyzing synthetic data and is not an instruction to grant execution privileges to actual operational tools.
제공한 합성 지표와 변경 이력만 사용해 원인 후보를 정리해 주세요.
각 후보마다 지지하는 관측, 아직 없는 근거, 반대 근거,
추가로 읽기 전용 확인할 항목을 구분해 주세요.
상관관계를 원인 확정으로 쓰지 말고 확인되지 않은 값은 만들지 마세요.
설정 변경이나 재시작은 실행하지 말고 별도 조치 제안으로만 남겨 주세요.
If retries are a candidate, you can check if DB call attempts for that code path actually increased during the same timeframe. If long transactions are a candidate, other observations such as lock waits or transaction duration are needed. Recording which data narrows down which candidate makes it easier for humans to review AI’s explanations.
Even a high confidence score assigned by the model is not a verification result in itself. In situations where necessary metrics are missing, a statement might appear definitive. If evidence is insufficient, the design should escalate to additional observations or human review instead of increasing the execution level.
4. Align Change History on the Same Timeline and Scope
The fact that an outage began immediately after a change is an important clue. However, it cannot be definitively concluded as the cause solely because it was a recent deployment. Deployment times and metric collection times may differ, and during a gradual deployment, new and old versions might operate simultaneously.
In the synthetic example, we isolate and examine only requests from versions with changed retry settings. We compare whether latency occurred in other paths of the same API, and whether connection waits increased in instances that did not receive the change. We also check for overlapping changes at the same time, such as increased demand or DB maintenance.
When conveying change history to AI, you should provide specific details about the target service, version, configuration item, and scope of application, rather than just saying “there was a deployment today.” If you don’t verify which observations refer to before and after the change, and if the timestamps and aggregation intervals align, different events might be grouped into a single narrative.
In operational summaries, facts and interpretations should be recorded separately. “Connection waits increased in the new version’s interval” is a confirmed comparison result, while “increased retries might have had an impact” is an interpretation. This distinction should be maintained to prevent unreviewed candidates from becoming confirmed root causes in reports.
5. Attach Targets, Conditions, and Limits to Automated Actions
Below is a design proposal applying the operational and authorization principles from official documents to this example. It does not mean that a specific AIOps product automatically provides all these features. Read-only summaries, change proposal creation, and restricted execution should be divided into different functions, each with its own allowed scope.
For example, continuously adding app instances simply because connection waits have increased can escalate DB load due to the connections each instance creates. Instead of just an action name like “scale out,” you must define the target for change, the magnitude of a single change, the overall connection budget, and the waiting time until the next decision.
Even allowed operations can be executed redundantly on the same target. When multiple alerts are grouped for one incident or retries continue, you must check the execution ID and progress status to avoid repeating the same configuration change. When retrying after an intermediate failure, first read the already changed state.
Permissions should be placed at the execution layer that can actually enforce these conditions. Instead of running freely generated shell commands from the model with administrator privileges, the design can ensure that only inputs allowed by reviewed operational procedures are passed. AWS IAM also explains the principle of least privilege, narrowing permissions to the actions, resources, and conditions required for a task. IAM Security Best Practices
The role of reading review records and the role of changing services should also be separated. Just because a summary function can suggest root cause candidates doesn’t mean it should also perform DB configuration changes or account permission modifications. You must define separately what data can be read and what resources can be changed.
6. Tie Approvals to Action Content and Reconfirm Immediately Before Execution
The execution boundary is not complete simply by a human approving. A broad approval like “it’s okay to fix the problem” can be misunderstood as remaining valid even if the target or method changes. It’s better for the approval screen to display the target version and resources, before-and-after values, expected impact, verification evidence, and recovery methods.
Approvals are tied to the version of the change proposal. If the target or parameters change after approval, or if the evidence becomes outdated, a new review is required. Since another operator might have already taken action while waiting, also check the current state and any ongoing changes immediately before execution.
AWS Systems Manager Automation’s aws:approve is an example where a step can be included in a workflow to wait for a response from a specified approver. The presence of such an approval step does not automatically ensure accurate root cause determination or execution permission validation. Permissions for approval, policy checks, and execution roles must be verified independently. Automation approve action
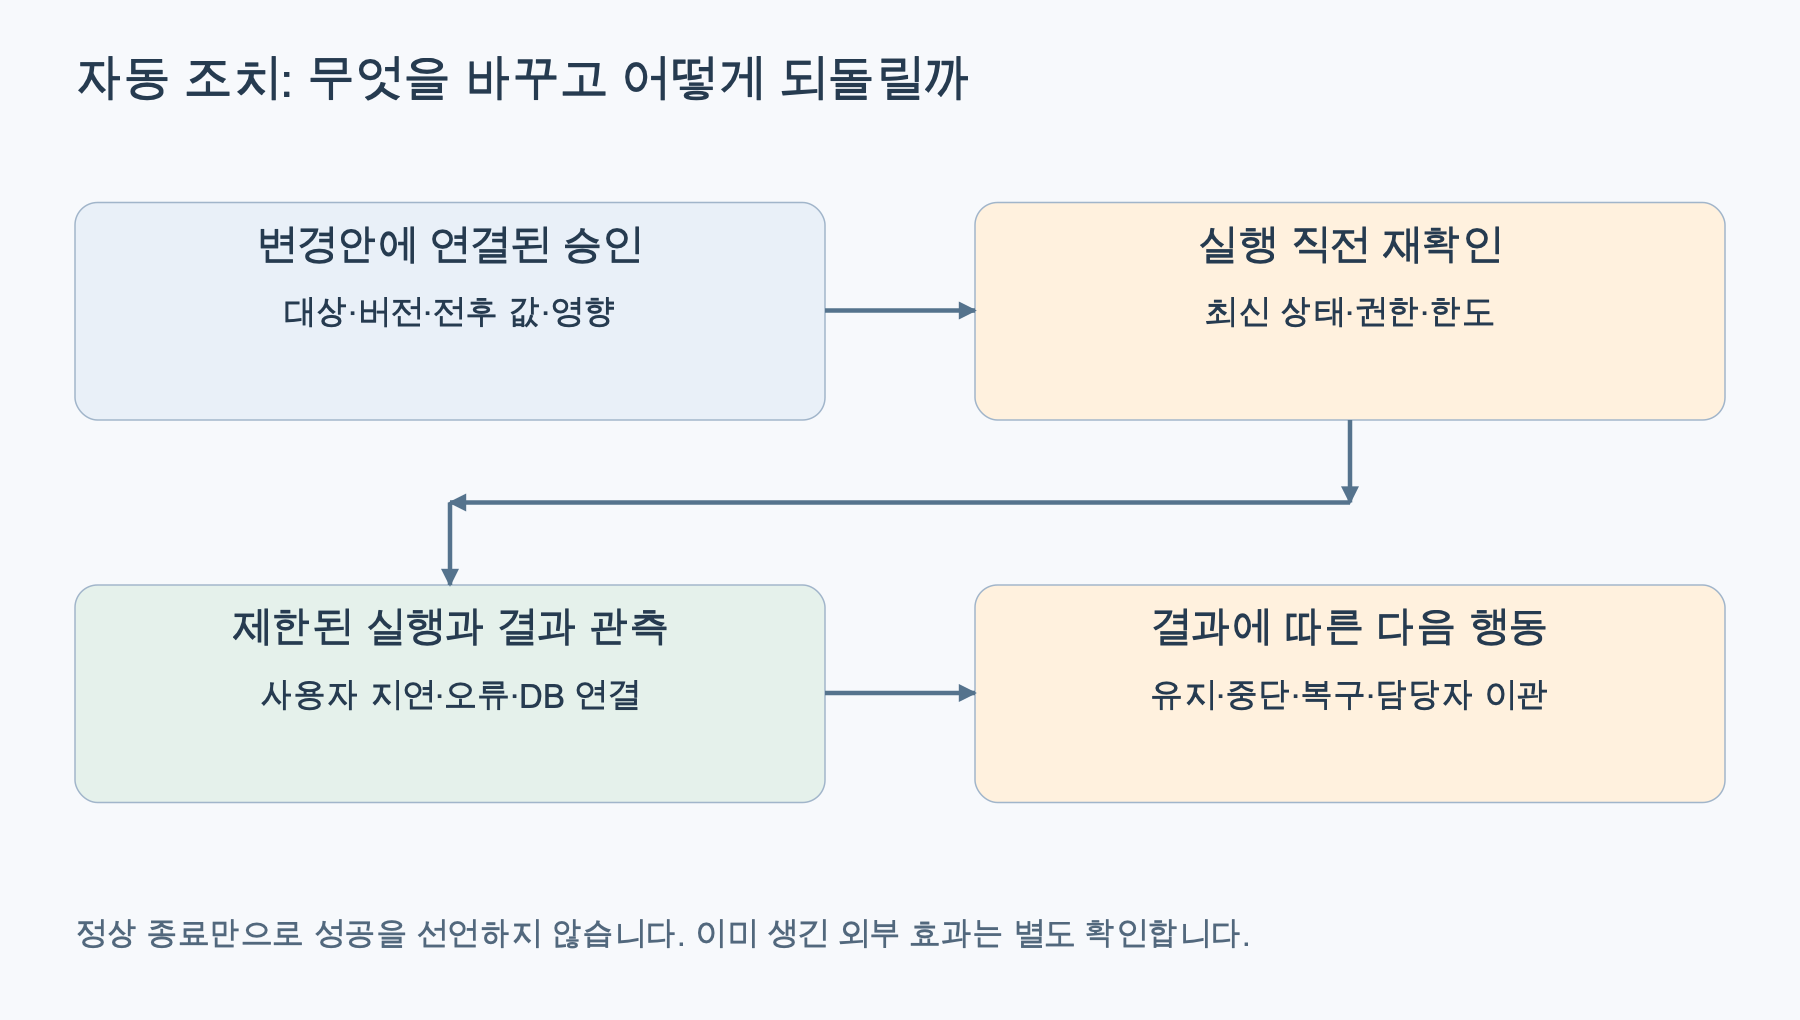
Figure 2. Operational design connecting approved change proposals with pre-execution status checks, restricted execution, and result observation. Reconstructed based on official documents such as Automation Approval documentation, IAM Permission Principles, and AWS Mitigating Deployment Risks. Execution is withheld in situations of unapproved changes, state mismatch, or unobservable conditions.
7. Define Success and Rollback Criteria Before Making Changes
Action success is different from the command completing without errors. If reviewing a change proposal to revert retry settings to previous values in the synthetic example, a plan is needed to observe product query latency, error rate, and DB connection wait/utilization together. If latency decreased but errors increased, it cannot be considered the desired outcome.
The judgment interval and minimum request volume must also be defined beforehand. You should not declare recovery based only on a brief quiet period immediately after a change or on intervals with almost no requests. The numbers should be determined based on the service’s load characteristics and objectives, and the example figures in this article should not be copied as operational thresholds.
Rollback is the procedure for reverting to a previous state. Secure the pre-change values and a recoverable version, and define which failure signals should halt new actions. AWS Well-Architected also covers rapid feedback on change results, recovery from undesirable outcomes, testing, safe deployment, and rollback together. Mitigate deployment risks
However, not all actions can be reverted in the same way. Already processed orders, messages sent externally, or data changes cannot be undone simply by restoring configuration files. For high-impact, irreversible operations, the automation scope should be further narrowed, and separate confirmations should be in place. If observation itself is interrupted during recovery, conditions are also needed to hand over to a human operator rather than repeating additional automatic changes.
8. Start Implementation with Read-Only Comparisons
Rather than aiming for automatic recovery from the start, you can examine what AI groups together and what it misses in past reviewed incidents or synthetic scenarios. Check whether root cause candidates are supported by evidence, if irrelevant changes are being pulled in, and if unknown information is marked as such.
Next, expand the scope by having AI generate proposals and compare them with existing operational judgments. When evaluating actions, the quantity of candidates generated is less important than unnecessary changes, false positive responses, the burden on human reviewers, and whether failures are recoverable. If there’s no data to measure effectiveness, don’t claim operational cost savings or reduced recovery time as achievements.
The previous Agent Safety Device Test discussed verifying the boundary that stops actual tool calls. In AIOps, an operational judgment is added before that boundary: Is there sufficient evidence to choose this action now? Even a tool that effectively prevents execution won’t solve the problem of choosing the wrong action.
9. The Scope of Delegation is Determined by Operational Contracts, Not Model Eloquence
The value of AIOps can begin with grouping scattered signals and organizing root cause candidates and evidence for human review. To connect to automated actions, the scope of evidence, targets, permissions, limits, approved change proposals, result judgment, and recovery methods must be linked.
The observation that a shopping mall API is slow and DB connections have increased is a starting point. The next step is not to get a command to restart the DB, but to decide which candidates to narrow down with which observations, and what can be changed under what conditions. By managing the tasks of trusting observations, judging causes, and permitting changes separately, the scope of automation can also be explained.
References
Official document verification date: October 15, 2026. Synthetic metrics and operational design examples were constructed for the purpose of this article’s explanation.
Leave a Reply