Hello! Today, we’re going to summarize the essential tool for mastering Cilium, the most powerful CNI (Container Network Interface) in a Kubernetes environment: the Cilium CLI.
When operating Cilium, you’ll inevitably encounter situations where you need to go beyond simple “installation” to troubleshoot why communication isn’t working and perform a deep dive analysis.
From installation to packet-level debugging, we’ve meticulously compiled the core commands you can use immediately in real-world scenarios. 📝
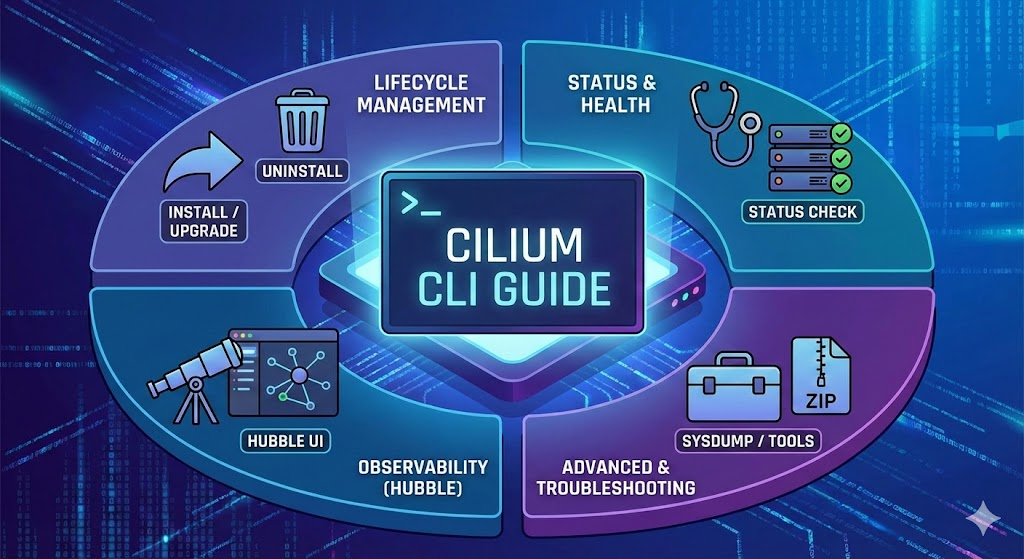
1️⃣ Installation & Lifecycle Management
These are the most basic commands related to installation, version checking, and uninstallation.
ℹ️ cilium version
Checks the Cilium CLI client version and the Cilium image version currently running in the cluster.
- Usage: This is the first step to perform when troubleshooting to check version compatibility between the client and the server (agent).
📦 cilium install
Installs Cilium in the cluster. It automatically detects cloud environments (EKS, GKE, etc.) and applies optimal configurations.
- Tip: You can directly inject Helm values using the –set flag. (e.g., cilium install –set ipam.mode=kubernetes)
🗑️ cilium uninstall
Cleanly removes all Cilium-related resources (ConfigMap, ServiceAccount, DaemonSet, etc.) from the cluster.
- Caution: If the CNI is removed, inter-pod communication will be disrupted, so caution is advised in production environments.
2️⃣ Status Diagnosis & Log Checking
This stage determines “Is my network currently healthy?”
🩺 cilium status
Provides an at-a-glance view of the Cilium agent, operator, and CNI status.
- Tip: Use the –wait option to wait until all components are in a Running state.
🧪 cilium connectivity test
This is a Golden Path test that validates network connectivity. It automatically tests inter-pod communication, DNS, and external connectivity based on various scenarios.
📜 kubectl logs -n kube-system
This is the last resort when the Cilium CLI isn’t working or even cilium status fails.
- Description: Uses standard Kubernetes commands to check the standard output logs of the Cilium agent (pod).
- Usage: Used to view raw logs to understand why an agent crashed (CrashLoopBackOff) or if there were any fatal errors during the initialization phase.
3️⃣ Endpoint & Policy Analysis
Cilium manages Pods as Endpoints. To check if firewall policies (Network Policies) are correctly applied, you need to look here.
(※ The commands below are primarily executed inside a Cilium pod or checked via a CLI wrapper.)
📋 cilium endpoint list
Displays summary information for all endpoints managed on the current node.
- Key Checkpoints:
- POLICY (Ingress/Egress): Must be in an Enabled state for firewall policies to be active. If Disabled, policies are not applied (Allow-all).
- IDENTITY: Cilium performs secure communication using this ID, not IP.
🔍 cilium endpoint get
Displays all detailed information for a specific endpoint (ID) in JSON format.
- Usage: Use this when you think, “The policy is enabled, but why isn’t communication working?” You can thoroughly examine the specific labels and policy rules applied to that endpoint.
4️⃣ Deep Dive Debugging & Observability
This is the domain of network engineers. It involves directly examining packet flow and eBPF status.
📡 cilium monitor
This is the ultimate tool for Cilium debugging. It streams packet events flowing through the eBPF data path in real-time.
- Usage: Similar to tcpdump, but at the eBPF level, it clearly shows whether packets are Dropped (blocked) or Forwarded (transmitted), along with explicit reasons.
- Tip: Using the
cilium monitor --type dropcommand is excellent for firewall debugging as it filters only dropped packets.
🧠 cilium bpf status
Checks the status of eBPF maps and resource usage.
- Usage: In large-scale clusters, when an error like “cannot establish any more connections” occurs, use this to check if the eBPF Map’s capacity is full.
🔭 cilium hubble ui
While cilium monitor is text-based, Hubble visualizes this data to draw a service map showing relationships between services. You can intuitively view traffic flow through a browser.
📝 Summary: Command Cheat Sheet by Situation
| Situation | Recommended Command |
|---|---|
| Installation & Version Check | cilium install, cilium version |
| Overall Health Check | cilium status –wait |
| When Agent is Down | kubectl logs -n kube-system |
| Check Policy Application | cilium endpoint list |
| Detailed Analysis of Specific Pod | cilium endpoint get |
| Trace Packet Drop Cause | cilium monitor –type drop |
| Resource Initialization | cilium uninstall |
—
Cilium offers powerful features, and with that comes many commands to learn. However, if you remember the flow we’ve outlined: Lifecycle -> Status -> Endpoint -> Monitor, you’ll be able to resolve any network issues without panic! 👍
May your Kubernetes network always be smooth! 🚀
Leave a Reply