When problems arise in a distributed system environment, we often trace the cause by following two important clues: logs and traces. However, it often feels like these two exist as islands in different worlds. 🏝️ Have you ever felt stuck, wondering, “Which request caused this error log?”
Today, we’ll explore OpenTelemetry’s ‘Log Bridge API,’ a magical bridge that connects these two worlds.
🤔 What is the Log Bridge API?
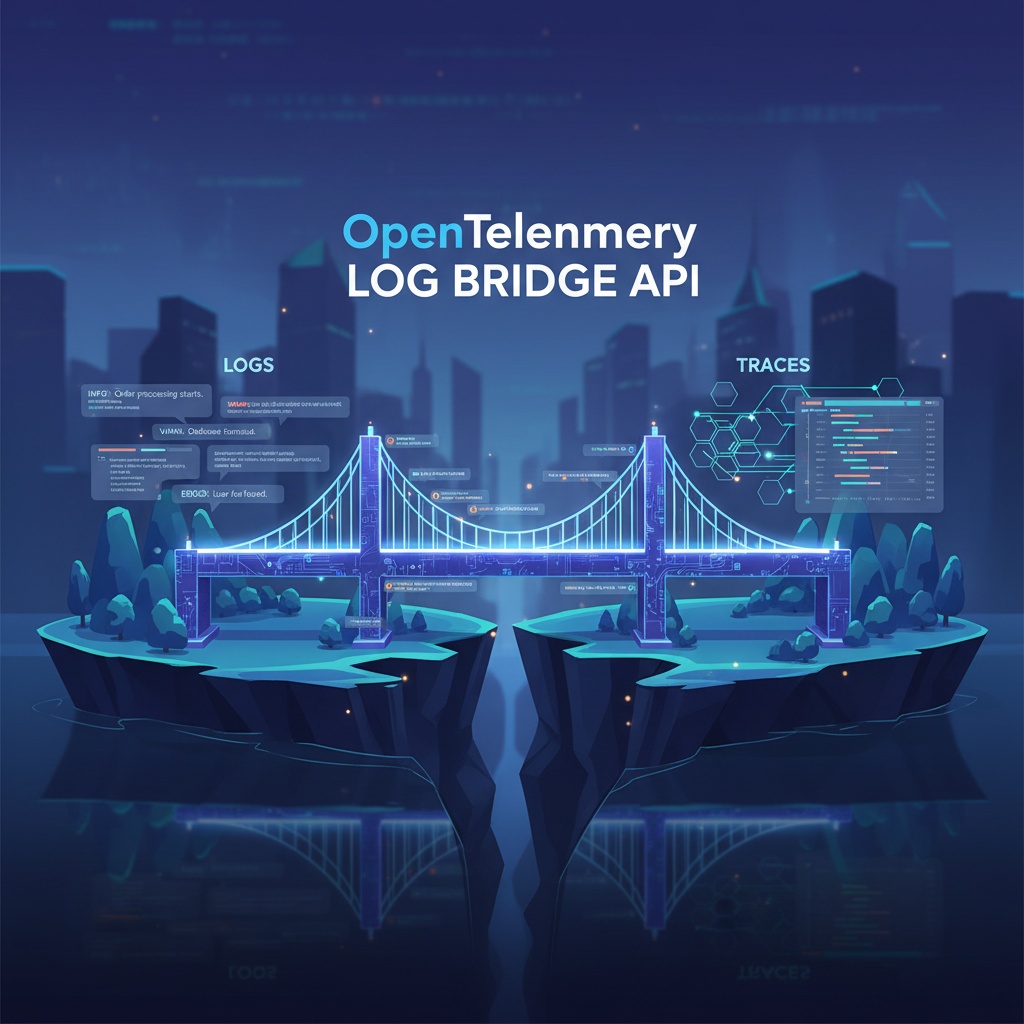
OpenTelemetry’s ‘Log Bridge API’ (or logging library integration feature) acts as a ‘bridge,’ as its name suggests. What kind of bridge? It’s a bridge that naturally connects your application’s existing logging libraries (e.g., Log4j, SLF4J, Winston, etc.) with OpenTelemetry.
The key is to provide powerful context to existing logs without developers having to modify a single line of existing logging code. 🚀
✨ How does it work? The Magical Principle
As developers, we usually log like this:
logger.info("주문 처리를 시작합니다.");When the Log Bridge API is configured, OpenTelemetry quietly intervenes the moment this ordinary log is recorded. It then automatically adds the unique identification information of the currently executing operation (Trace), namely Trace ID and Span ID, to the log.
[BEFORE] 😱
INFO: 주문 처리를 시작합니다.[AFTER] 😎
INFO: 주문 처리를 시작합니다. {trace_id: "abc123xyz", span_id: "def456uvw"}Since this entire process is automated, developers can maintain their existing logging practices. Isn’t that convenient?
👍 Tremendous Benefits of the Log Bridge API
- Perfect Correlation of Logs and Traces 🔗 No more headaches trying to correlate separate log and trace data. With just one specific Trace ID, you can filter and view all related logs at once. It becomes incredibly easy to understand the entire flow of a specific request where an error occurred and all logs left during that process, in chronological order.
- Perfect Compatibility with Existing Code ✅ No need to learn new logging methods or modify hundreds or thousands of logger.info() lines of code. You can continue using your familiar logging libraries while benefiting from OpenTelemetry’s powerful distributed tracing capabilities.
- Enhanced Observability 🔭 Logs tell us “what happened,” and traces tell us “where and how it happened.” The Log Bridge API combines these two to help us understand system behavior much more deeply and comprehensively.
🧐 Debunking Common Misconceptions!
There are sometimes misunderstandings about the Log Bridge API. Let’s clarify them now!
- “Does it convert trace data into logs?” ❌
- No! It doesn’t convert traces into logs; rather, it adds trace context (IDs) to existing logs to link them.
- “Does it bypass the OpenTelemetry SDK?” ❌
- No! The Log Bridge API operates as part of the SDK and leverages the SDK’s context propagation capabilities to enrich logs.
- “Does it provide a new logging framework?” ❌
- No! Its goal is not to create something new, but to integrate (Bridge) with existing, proven logging frameworks to create synergy.
Conclusion
Debugging and monitoring in distributed environments are becoming increasingly complex. OpenTelemetry’s Log Bridge API is a powerful solution that weaves together logs and traces, two core data points, amidst this complexity. If you want to elevate your observability without modifying code, consider adopting the Log Bridge API now!
Leave a Reply