“Oh? A feature I frequently used has been moved to a more convenient location?”
“This update seems to have made the app much cleaner.”
You’ve probably had experiences like this every time the smartphone apps we use daily are updated, right? Sometimes it feels as if the developers have read your mind. This isn’t just a coincidence or a hunch. It’s because they’ve listened to the user’s voice hidden in data. 🤫
Today, we’ll explore how developers analyze user behavior to create better apps, and delve into ‘Telemetry Data,’ the key to this secret, in an easy-to-understand and detailed way.
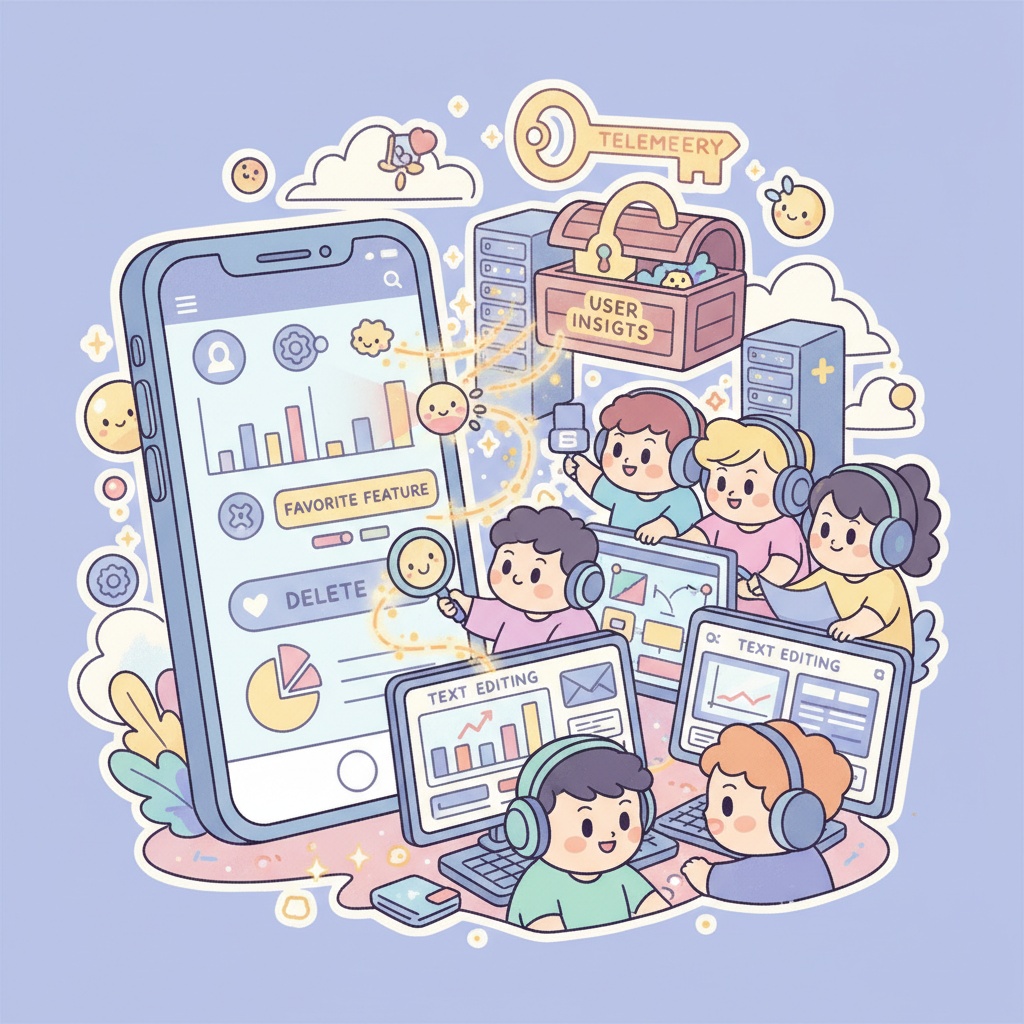
🚀 Developers’ Secret Weapon: What is Telemetry Data?
Telemetry refers to the technology of collecting and measuring data remotely. In the world of app development, it means collecting anonymous data on how users interact with the app. This data serves as the most honest feedback channel, informing developers about users’ hidden needs and inconveniences. 📡
So, what specific data do developers collect to improve apps?
These three are key:
- User Settings ⚙️
- Feature Usage 📊
- Engagement Levels 🚶♂️
Let’s examine the overall process to see how these three types of data are combined to create ‘mind-reading’ updates.
🗺️ The Entire Process: Data’s Journey to Transform Apps
App improvement isn’t achieved with just a single piece of data. It proceeds through a systematic flow like the one below:
Data Collection ➡️ Data Analysis ➡️ Insight Derivation ➡️ Improvement Execution
To understand this process, let’s look at the data collection method of a hypothetical photo editing app, ‘PictureUp,’ as an example:
1. Data Collection: Recording User Traces
First, a protocol is established for what data to collect. For instance, whenever a user performs a specific action, the app can be designed to send logs in the following format to the server:
// Define event log protocol for 'PictureUp' app
{
  "event_name": "string", // Name of the event that occurred (e.g., feature_used, screen_view)
  "timestamp": "datetime", // Event occurrence time
  "user_id": "string", // Anonymized user ID
  "properties": { // Additional information related to the event
    "feature_name": "string", (optional) // Name of the feature used
    "screen_name": "string", (optional) // Name of the screen being viewed
    "setting_value": "string" (optional) // Changed setting value
  }
}
According to this protocol, the actual collected data (Raw Data) would look like this:
// Raw Data example
[
  {
    "event_name": "screen_view",
    "timestamp": "2025-11-05T08:42:11Z",
    "user_id": "user_abc_123",
    "properties": { "screen_name": "main_editing_screen" }
  },
  {
    "event_name": "feature_used",
    "timestamp": "2025-11-05T08:42:15Z",
    "user_id": "user_abc_123",
    "properties": { "feature_name": "auto_enhance_filter" }
  },
  {
    "event_name": "settings_changed",
    "timestamp": "2025-11-05T08:43:02Z",
    "user_id": "user_xyz_789",
    "properties": { "setting_name": "export_quality", "setting_value": "high" }
  },
  {
    "event_name": "feature_used",
    "timestamp": "2025-11-05T08:43:20Z",
    "user_id": "user_abc_123",
    "properties": { "feature_name": "manual_brightness_control" }
  }
]
2. Analysis and Insights: Finding Gems in Data 💎
Analyzing the collected data can reveal surprising facts:
- (Feature Usage) “Wow, 80% of all users use the ‘Auto-Correction Filter’ feature, but less than 5% use the ‘Manual Brightness Adjustment’ feature hidden in a corner? Users even get lost trying to find this feature an average of 3 times or more.”
- (Engagement Levels) “Users complete tasks on the ‘Crop Photo’ screen in an average of 10 seconds and leave, but on the ‘Add Text’ screen, 40% of users stay for over a minute and then just press the back button. The UI must be too complex, causing them to give up!”
- (User Settings) “Most users set ‘Export Quality’ to ‘High Quality,’ so it would be good to change the default to ‘High Quality’.”
3. Improvement Execution: The Birth of Smart Updates! 💡
Based on these insights, the development team can make the following decisions:
- Move the most popular ‘Auto-Correction Filter’ button to the most visible spot on the main screen.
- Boldly remove the ‘Manual Brightness Adjustment’ feature, which has low usage and only confuses users, or hide it within ‘Advanced Settings’ to simplify the screen.
- Improve the UI of the ‘Add Text’ screen, where users experience difficulties, to be more intuitive.
- Change the default ‘Export Quality’ to ‘High Quality’ to reduce unnecessary clicks for users.
This is data-driven user experience (UX) improvement.
🤔 What about these? Wrong Approaches
Sometimes, attempts to improve user experience can actually ruin an app. Let’s look at some examples:
1. “Crash reports are annoying, let’s disable them!” 😱
- Why is this wrong? A crash report is an SOS signal sent to developers when an app unexpectedly terminates. Through these reports, developers can identify the circumstances under which bugs occur and resolve them. Disabling crash reports is like a doctor refusing to listen to a patient’s symptoms. Ultimately, bugs won’t be fixed, and users will continue to experience inconvenience.
2. “Data is complicated! Let’s trust our gut and develop!” 👨💻
- Why is this wrong? A developer’s intuition and experience are certainly important. However, developers are not users. What a developer considers a ‘convenient feature’ and what users actually ‘frequently use’ can be different. Ignoring user behavior data is like navigating the open sea without a compass. Ultimately, the app may drift in a direction users don’t want.
3. “Let’s only support the latest devices to make the app stable!” 📱
- Why is this wrong? Supporting only specific latest devices is an entirely different issue from improvement using telemetry data. In fact, it results in missing out on many potential users. Identifying and resolving issues that occur on various devices and increasing app accessibility is fundamental to user experience improvement.
✨ Conclusion: Every Tap of Your Finger Helps Apps Grow
As we’ve seen today, behind every well-made app lies the developers’ effort to humbly listen to and learn from user behavior data. Every button you casually press, every feature you frequently use, comes together to form a valuable voice that creates better apps.
Next time an app update notification appears, why not wonder, ‘What traces of mine have changed the app this time?’ 😊
Leave a Reply