Our service has experienced an outage! 😱 API responses are delayed, and 500 errors are occurring intermittently.
- Team A opens the Grafana dashboard to check CPU and memory metrics.
- Team B connects to Kibana to search for error logs.
- Team C examines distributed tracing (Trace) data for specific requests in the Jaeger UI.
Each team can only see fragmented information in their respective tools. “The CPU spiked for a moment, but is that the direct cause?”, “I see error logs, but which request caused them?”, “Is the time when this Trace slowed down related to the CPU spike?”
Ultimately, to find the cause, multiple teams gather, share their screens, and go through the arduous process of aligning timelines. The outage lengthens, and customer complaints pile up.
At the heart of all these problems is ‘Tool Sprawl’.
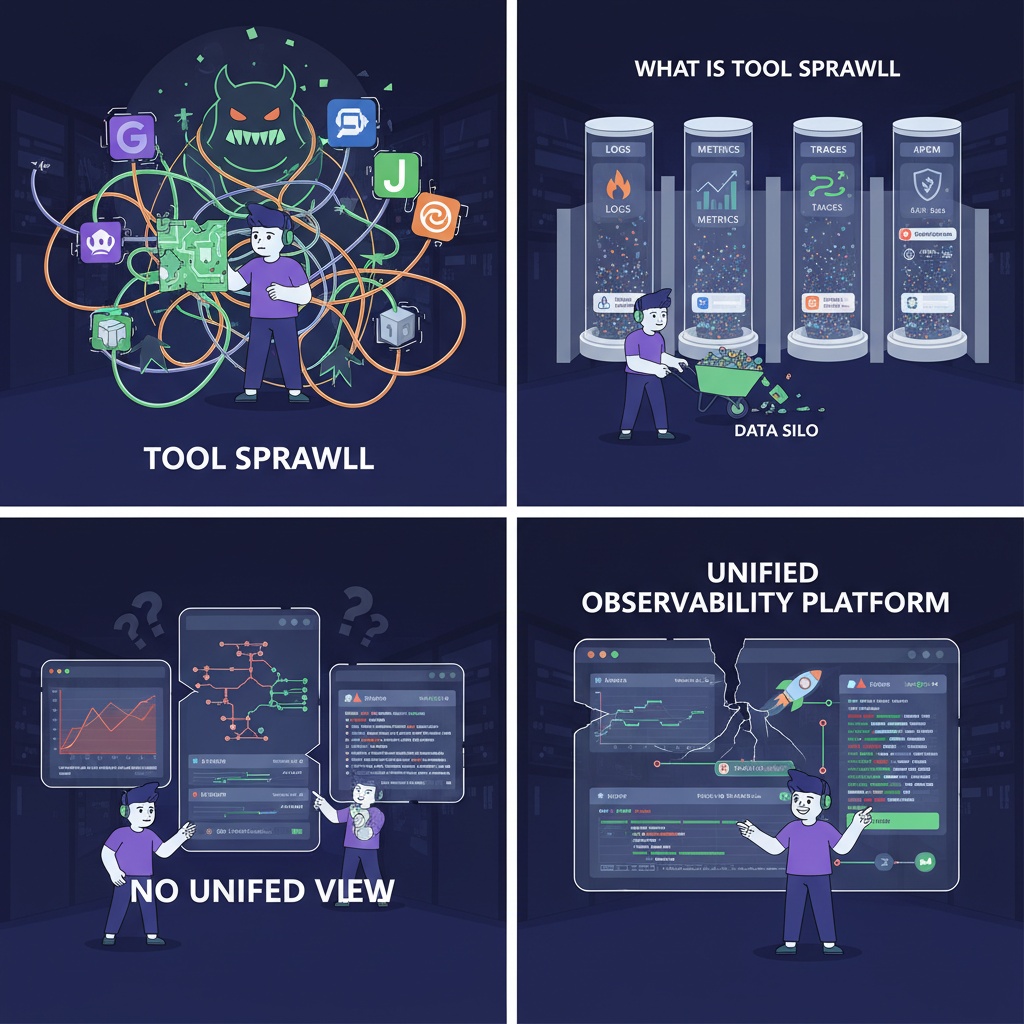
🧩 What is Tool Sprawl?
Tool Sprawl literally means a state where ‘tools (Tool) are indiscriminately spread (Sprawl)’. Especially in modern MSA (Microservice Architecture) environments, various technology stacks, open-source solutions, and SaaS solutions are often introduced according to each function and purpose.
- Log Collection: ELK Stack (Elasticsearch, Logstash, Kibana)
- Metric Collection/Monitoring: Prometheus, Grafana
- Distributed Tracing: Jaeger, Zipkin
- APM: Datadog, New Relic
Each tool performs excellently in its specific domain, but when introduced without an integrated strategy across the organization, it leads to a ‘Data Silo’ phenomenon where data gets trapped within each tool.
This is the most critical problem caused by Tool Sprawl.
🔗 The Biggest Problem: Lack of a ‘Unified View’
While Tool Sprawl has several disadvantages (increased costs, learning curve, etc.), the most painful aspect in an operational environment is the absence of a ‘unified view’ that allows you to see the overall state of the system at a glance.
When data is scattered across multiple tools, you can see individual data fragments, but it becomes very difficult to connect those fragments to form the big picture.
😠 Difficulties in Actual Outage Situations
For example, let’s follow the process of resolving a ‘slow API’ issue.
1. Check Metrics (Prometheus/Grafana) First, through metrics, we discover that http_requests_latency_seconds for the ‘api-gateway’ service has sharply increased.
# Prometheus Alert Rule
- alert: HighApiLatency
  expr: histogram_quantile(0.99, sum(rate(http_requests_latency_seconds_bucket{service="api-gateway"}[5m])) by (le)) > 2
  for: 1m
  labels:
    severity: critical
  annotations:
    summary: "High API Latency on api-gateway"
    description: "The 99th percentile latency for api-gateway is over 2s."
2. Check Distributed Tracing (Jaeger) Now, to find out why it slowed down, we go to Jaeger. We search for traces from that time period and find a particularly slow request.
Trace ID: a1b2c3d4e5f6
// Raw Trace Data (Simplified)
{
  "traceID": "a1b2c3d4e5f6",
  "spans": [
    {
      "spanID": "span1",
      "operationName": "HTTP GET /api/user",
      "startTime": 1767282061000,
      "duration": 2150, // 2.15 seconds, very slow!
      "tags": [{"key": "http.status_code", "value": 200}]
    },
    {
      "spanID": "span2",
      "parentSpanID": "span1",
      "operationName": "Call to user-service",
      "startTime": 1767282061100,
      "duration": 2000 // This internal call takes up most of the time
    },
    {
      "spanID": "span3",
      "parentSpanID": "span2",
      "operationName": "DB Query: SELECT * FROM users",
      "startTime": 1767282061500,
      "duration": 1500 // DB query seems to be the cause of the problem
    }
  ]
}
3. Check Logs (Kibana) Looking at the Trace, it seems the DB query in the user-service is slow. To pinpoint the exact cause, we manually copy the Trace ID and paste it into the Kibana search bar.
// Raw Log Data (in Elasticsearch)
{
  "@timestamp": "2025-11-04T08:41:02.550Z",
  "log.level": "ERROR",
  "service.name": "user-service",
  "message": "DB Connection Pool exhausted. Waited 1200ms for connection.",
  "trace.id": "a1b2c3d4e5f6", // Finally found the link through this ID
  "transaction.id": "t9y8x7w6"
}
Finally, the cause was found: a DB connection pool exhaustion issue.
However, during this process, the engineer had to switch between three different tools (Grafana, Jaeger, Kibana), adapting to different UIs and query languages, and switching context. This is the inefficiency created by the lack of a unified view. In an outage situation, every second counts, but most of the time is wasted on data exploration to identify the cause.
🤔 Are Other Problems Not Core?
Of course, Tool Sprawl causes other problems. But why is the ‘lack of a unified view’ the most critical?
- “The license and maintenance costs of multiple tools are the biggest problem” (❌)
- Of course, cost 💰 is an important factor. However, the losses incurred by a business due to service downtime (customer churn, decreased trust, reduced revenue) often far exceed license costs. From a technical perspective, hindering problem-solving ability is a more fundamental issue.
- “The learning curve for engineers to learn multiple tools is the biggest problem” (❌)
- This is also a clear disadvantage 📚. However, even assuming all engineers are proficient in all tools, as long as data is fragmented, the ‘inefficient workflow of jumping between tools’ itself remains unresolved. The essence of the problem lies not in individual proficiency, but in systemic inefficiency.
✨ Conclusion: See the Whole, Not Just the Pieces
As services become more complex, we can no longer understand the overall system behavior with individual logs, metrics, and trace data alone. Tool Sprawl fragments this data, making it difficult to identify correlations and causing us to miss the golden time for problem resolution.
For successful system operation and stable services, we must aim for an integrated Observability platform that automatically connects scattered data fragments to understand the organic flow (Logs ↔ Metrics ↔ Traces) on a single screen. This is the first step to escaping the trap of Tool Sprawl. 🚀
Leave a Reply