Hello! Today, we’re going to dive deep into Sum, one of OpenTelemetry (OTel)’s core metric types. 🕵️♂️ Many people think of Sum as simply a ‘metric that calculates a total,’ but did you know there are two important properties that determine how it behaves?
These are Monotonicity and Aggregation Temporality. Only by understanding these two axes can you accurately interpret and utilize Sum metrics. So, let’s explore these two concepts in detail!
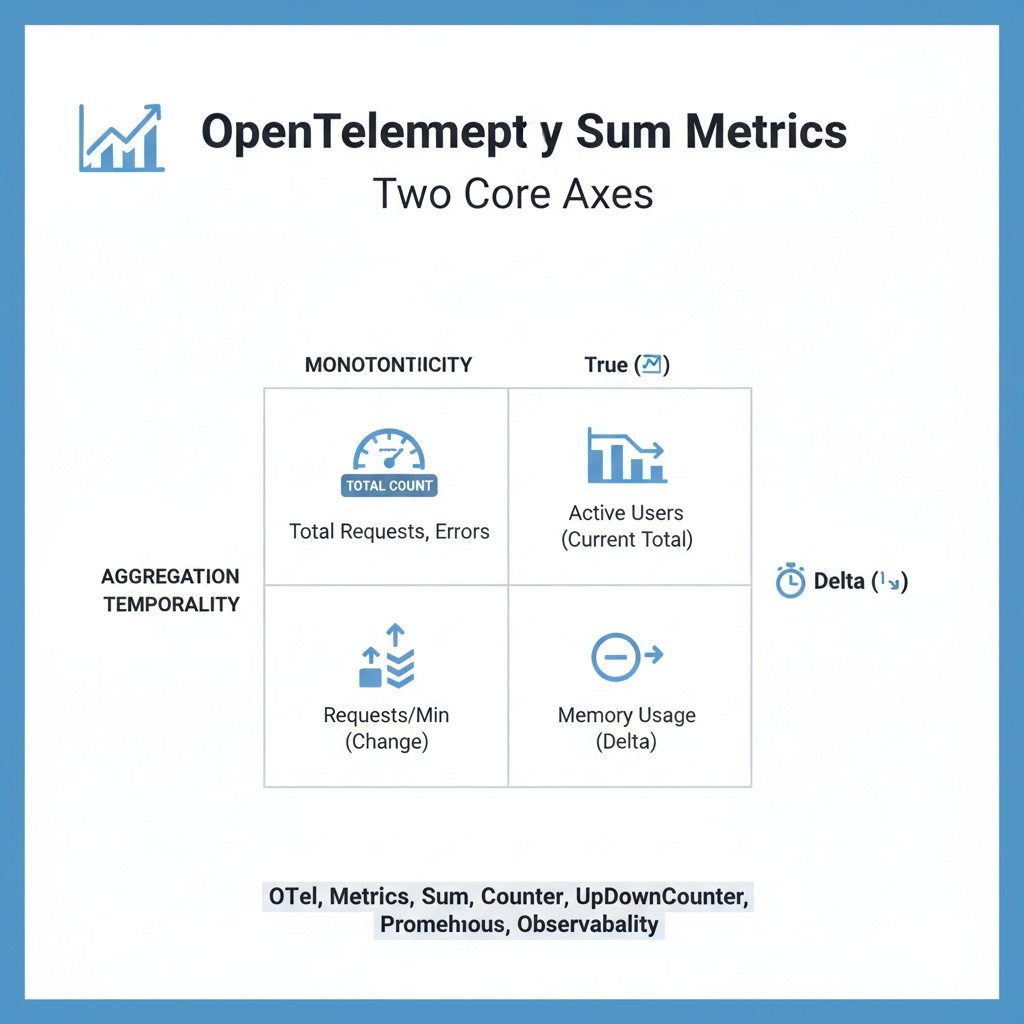
🗺️ See the Full Context: The Two Axes of Sum Metrics
It’s important to first understand the two key factors that determine how Sum metrics behave. These are not independent concepts but rather combine to define the ultimate nature of a Sum metric.
- Monotonicity: Can this value only increase, or can it both increase and decrease?
- Aggregation Temporality: When reporting (exporting) metrics, will you send the total cumulative value, or only the recent change?
The combination of answers to these two questions is what the Sum metric you see will look like.
The image you are requesting does not exist or is no longer available
1️⃣ First Axis: Monotonicity
Monotonicity is a rule about the direction of value change.
✅ Monotonic: true (Monotonically Increasing)
This means the value can only increase or stay the same, never decrease. Just like a car’s total mileage odometer – it doesn’t go backward! 🚗
- Characteristics: Only zero or positive values are added.
- Examples of Use:
- Cumulative API request count
- Total number of errors since the service started
- Total data bytes transferred
- Related OTel Instrument: Counter
↕️ Monotonic: false (Non-monotonic, can increase/decrease)
This means the value can both increase and decrease. Like the number of people in a room: it increases when people enter and decreases when they leave. 👨👩👧👦
- Characteristics: Positive or negative values can be added.
- Examples of Use:
- Current active connection count (+1 on connect, -1 on disconnect)
- Number of items in a message queue (+1 on publish, -1 on consume)
- Change in memory usage
- Related OTel Instrument: UpDownCounter
2️⃣ Second Axis: Aggregation Temporality
Aggregation Temporality is a very important property that determines what time reference collected metric values will be reported against. This setting is usually decided at the Exporter level, which sends out the final data.
🧱 Cumulative (Accumulated)
Cumulative, as the name suggests, reports the total cumulative sum from the start of the process (application) to the current moment.
- Characteristics: The value is not reset at each reporting interval and continues to accumulate. (However, if Monotonic: false, the value can decrease.)
- Why use it?: Monitoring systems like Prometheus prefer this method. When calculating the rate of change over a specific period, calculating based on the total cumulative value is more robust against data loss (e.g., collection failures). If you only received delta values and missed one collection, the data for that period would be lost forever.
- Reporting Example (Cumulative Request Count):
// Assume metrics are reported at 1-minute intervals
// T=0: Service start

// T=1min: 100 requests occurred
export({"http.server.requests": 100})

// T=2min: An additional 150 requests occurred
export({"http.server.requests": 250}) // Previous 100 + New 150

// T=3min: An additional 60 requests occurred
export({"http.server.requests": 310}) // Previous 250 + New 60
As you can see, the value always represents the total cumulative sum.
💧 Delta (Change)
Delta reports only the change (increase or decrease) since the last reporting interval.
- Characteristics: Once reported, the internal aggregated value is reset for the next report.
- Why use it?: It aligns well with systems that emphasize
Leave a Reply