“I’m clearly looking at metrics… why do the numbers seem to be jumping strangely? 🤔”
“Why does a graph that looked fine in Prometheus appear broken in other monitoring tools?”
If you’ve ever had these concerns, you might be missing one of OpenTelemetry’s most crucial concepts: ‘Aggregation Temporality’.
Today, we’ll thoroughly explore two concepts that many find confusing: ‘Aggregation Temporality’ and ‘Temporal Reaggregation’. Failing to distinguish between them can completely distort your data!
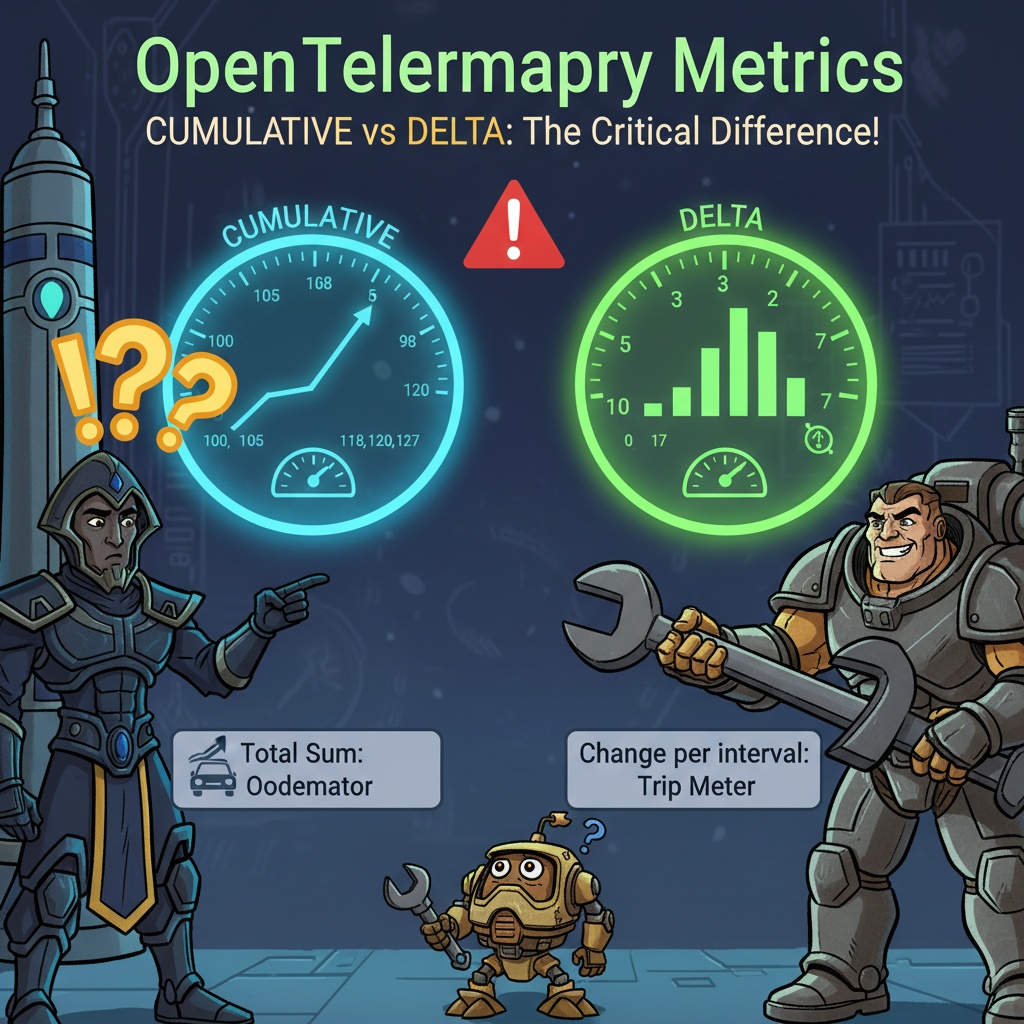
🕵️♂️ The Nature of Data: Aggregation Temporality
First, let’s understand ‘Aggregation Temporality’, which defines ‘what time perspective’ a data value represents. It’s the answer to the fundamental question: “From when to when does this number represent a value?”
There are two types:
A) CUMULATIVE: The sum of everything so far 📈
- Meaning: This is the cumulative sum of all values that have occurred since the process (application) started.
- Characteristics: The value continuously increases or at least remains the same (for counters).
- Analogy: Think of a car’s odometer 🚗. Even if you turn the engine off and on, the total mileage doesn’t reset; it keeps accumulating. That’s the principle.
- Example: http_requests_total counterAs you can see, the value keeps accumulating.
# 10:00 - 10:01 (5 requests occurred)
- 보고되는 값: requests_total = 5

# 10:01 - 10:02 (3 additional requests occurred)
- 보고되는 값: requests_total = 8  (기존 5 + 신규 3)

# 10:02 - 10:03 (10 additional requests occurred)
- 보고되는 값: requests_total = 18 (기존 8 + 신규 10)
B) DELTA: The change at this very moment 📊
- Meaning: This refers only to the amount of change that occurred during the current reporting interval, since the last report.
- Characteristics: It has an independent value for each reporting interval.
- Analogy: It’s like a car’s trip meter 🛣️. You reset it at a certain point and measure only the distance to the next destination.
- Example: http_requests_total counterIt cleanly shows only the change at each point in time.
# 10:00 - 10:01 (5 requests occurred)
- 보고되는 값: requests_total = 5

# 10:01 - 10:02 (3 requests occurred)
- 보고되는 값: requests_total = 3

# 10:02 - 10:03 (10 requests occurred)
- 보고되는 값: requests_total = 10👨🍳 How to Cook Data: Temporal Reaggregation
Now that we understand the ‘nature’ of data, it’s time to learn how to ‘process’ it.
‘Temporal Reaggregation’ is the process of changing the time granularity of collected metric data. For example, taking data collected meticulously every minute and combining it into larger 10-minute chunks to create a summary. Why do this? To save data storage space and speed up queries when looking at long-term trends. 🚀
Key Point: The reaggregation method changes completely depending on whether the original data’s Temporality is CUMULATIVE or DELTA!
A) Reaggregating DELTA data: Just add them up! ✅
- Method: It’s very simple. Just add them up. ➕ Summing all the changes in each interval gives you the total change for the entire interval.
- Example: Let’s combine five 1-minute DELTA values to create a 5-minute DELTA value.
# DELTA values for each 1-minute interval
1분차: 5
2분차: 3
3분차: 10
4분차: 2
5분차: 7

# Total DELTA value for 5 minutes
5min_delta = 5 + 3 + 10 + 2 + 7 = 27
B) Reaggregating CUMULATIVE data: The magic of subtraction 🔮
- Method: Simply adding these up would be a disaster! You must subtract the cumulative value at the beginning of the period from the cumulative value at the end of the period to get the true change (DELTA) during that period.
- Example: Let’s calculate the change over 5 minutes using 1-minute interval CUMULATIVE data.
# CUMULATIVE values at each point (total mileage)
T0 (시작): 100
T1: 105
T2: 108
T3: 118
T4: 120
T5 (끝): 127

# Calculate total change (DELTA) over 5 minutes
5min_delta = (T5의 누적값) - (T0의 누적값)
           = 127 - 100
= 27- ❌ What if you just added them up? You’d get an enormous number like 100 + 105 + 108 + 118 + 120 + 127. This would become meaningless data, “the sum of sums.” This is the moment data gets completely distorted!
💡 The Big Picture: So why is this important?
Okay, now we understand the difference between the two concepts. But why is it so important?
CategoryAggregation TemporalityTemporal Reaggregation
| Category | Aggregation Temporality | Temporal Reaggregation |
| Key Question | 🕵️♂️ “Is this value cumulative or a change?” | 👨🍳 “How should these data be combined?” |
| Determining Entity | SDK (Application code level) | Collector, Backend (Collection/Storage system level) |
| Concept | Data’s ‘fundamental attribute’ | ‘Data processing methodology’ based on that attribute |
Simply put, when an application (SDK) creates a metric, it attaches a label saying, “This is a CUMULATIVE value!” Then, the collector or backend receiving the data sees that label and correctly determines, “Ah, it’s a cumulative value! So, when reaggregating, I should subtract instead of add!” and processes it accordingly.
If this agreement isn’t honored, or if the system doesn’t properly understand Temporality, terrible things happen.
- Adding CUMULATIVE data as if it were DELTA → The graph will show absurd spikes, shooting through the roof. 😱
- Mistaking DELTA data for CUMULATIVE → The value will appear to hover near 0, causing you to miss actual changes. 😥
Ultimately, a precise understanding and distinction between these two concepts are the most fundamental prerequisites for accurate monitoring, reliable alerting, and correct data analysis.
Conclusion: Know your data’s nature, and cook it correctly!
‘Aggregation Temporality’ is the identity of data (What), and ‘Temporal Reaggregation’ is the recipe appropriate for that identity (How). If you are observing systems based on OpenTelemetry, it’s crucial to always be aware of the ‘Temporality’ of the data you are looking at and to ensure that the correct ‘Reaggregation’ is taking place.
Now, take another look at your metric graphs. Are your data being distorted by the wrong recipe? 😉
Leave a Reply