OpenTelemetry (OTel for short) is an open standard for collecting and transmitting traces, metrics, and logs generated by applications in a common way. Simply put, it’s a translation rule that standardizes the observation journals that different machines used to write in their own formats.
However, what you really want to see in an LLM service isn’t just “Did the model API succeed?”. You need to know if the answer was slow because the search was slow, or if the model’s first token was delayed, if a tool call was retried, or if the wrong document was retrieved. If you only record model calls, it’s like seeing only the start and end points of a long journey, without knowing where you got lost in between.
To get straight to the point, choosing OTel as the foundation for LLM observability aligns with current standard practices. However, the maturity of OTel’s core tracing and metric framework should be distinguished from the LLM-specific gen_ai.* conventions. The former is broadly stable, while the latter still includes development stages that may change. LGTM does not replace this standard; rather, it is a representative open-source backend combination for storing and querying collected data.
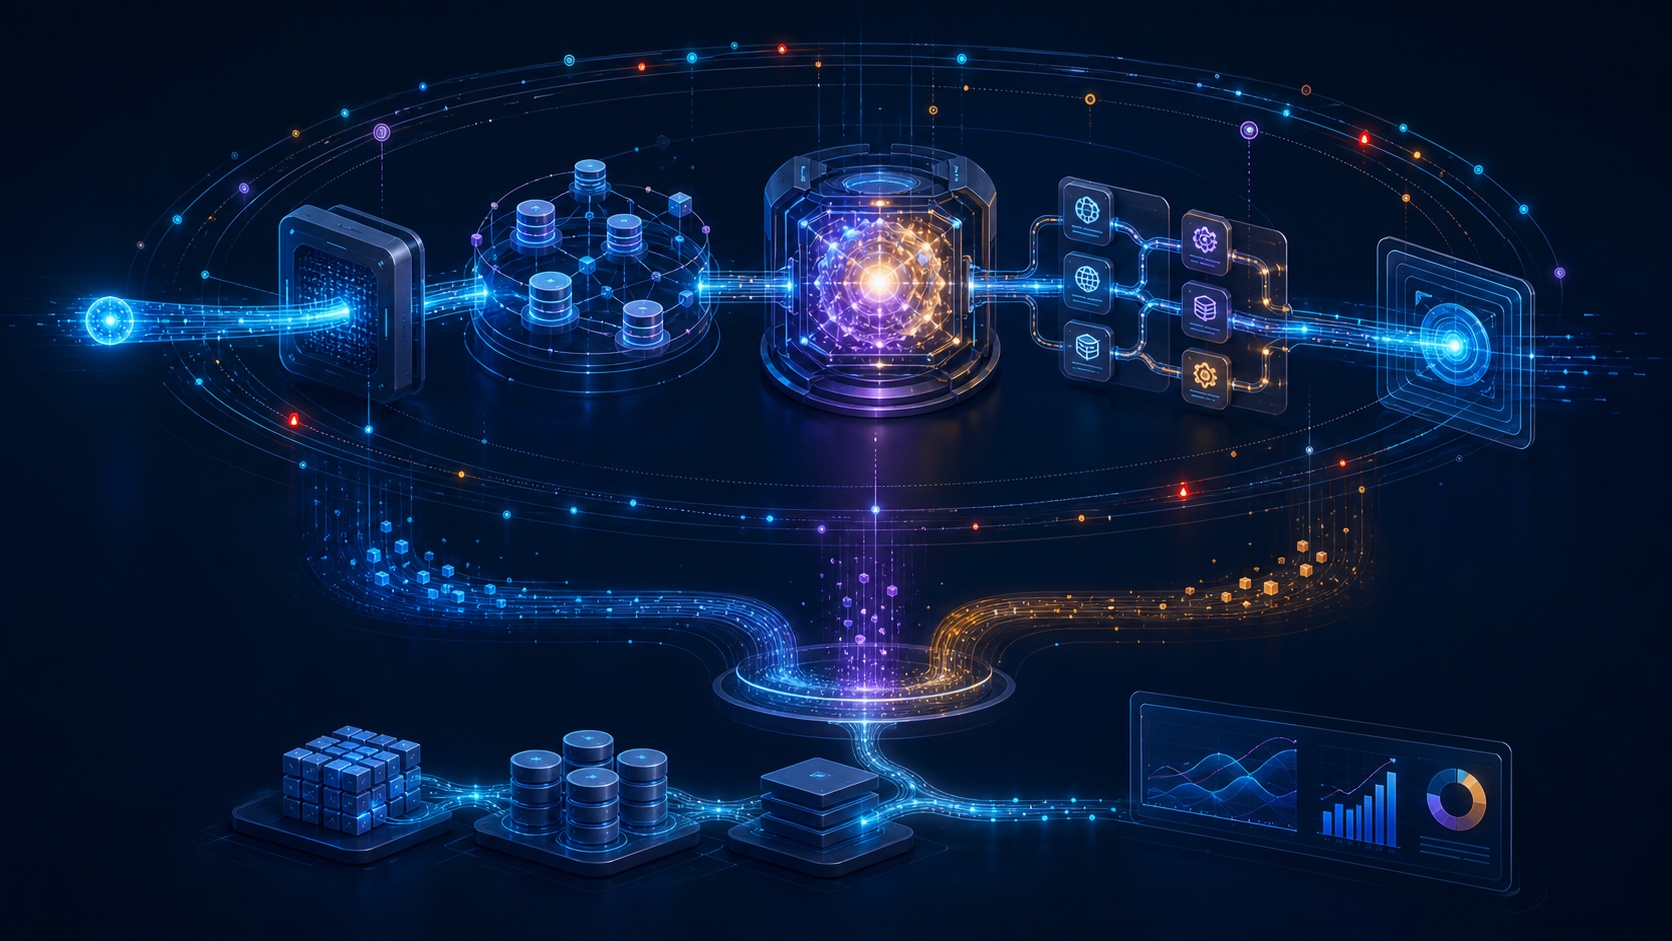
Telemetry connecting the entire journey as a single user request passes through search, model, and tools. This image was newly created for this article.
Why is existing monitoring insufficient for LLM services?
For typical web APIs, many problems can be found with just request count, error rate, CPU, memory, and response time. These metrics are still important for LLM systems. However, LLM applications usually go through more steps within a single request.
Let’s say a user asks, “Tell me our company’s refund policy.” The service first checks authentication and safety policies, converts the question into an embedding, finds relevant documents in a vector database, composes a prompt, and calls the model. If necessary, it also executes internal APIs or external tools before post-processing the answer.
At this point, the screen might simply show “Took 8 seconds.” However, the answer an operator needs is much more specific.
- Did the search phase take 5 seconds?
- Did the model take a long time to send the first character?
- Did a tool call fail and retry three times?
- Was a more expensive model used as a fallback, increasing token costs?
- Was the answer fast but based on irrelevant documents?
To answer these questions, each user request needs to be tagged with the same trace_id, and each operation within it divided into spans. A Span can be easily thought of as a “receipt for one segment” recorded within a Trace, which is the entire journey. It includes the start time, end time, success status, and attributes like model and tool.
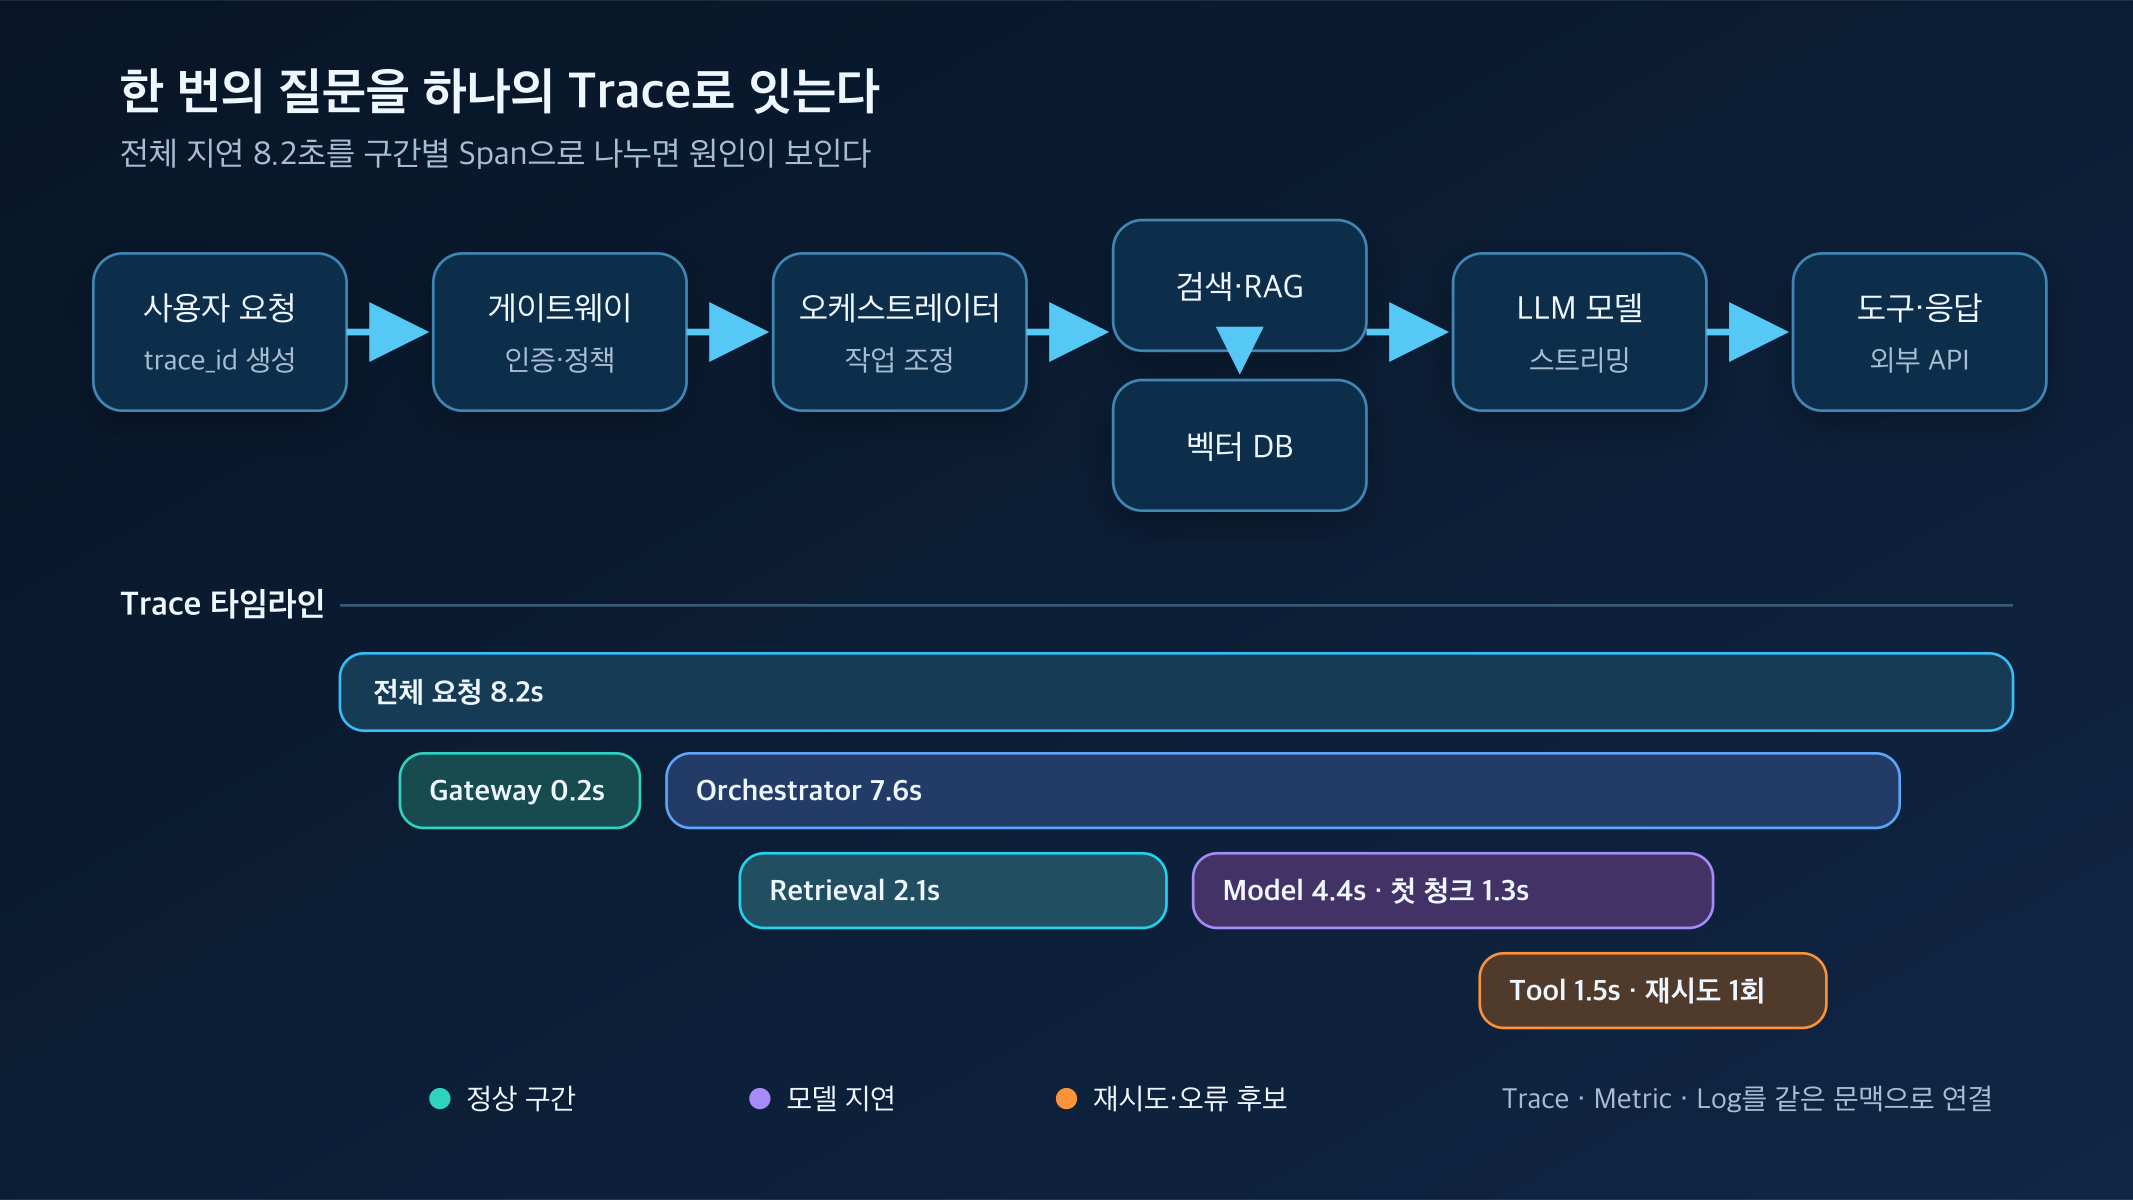
By connecting multiple Spans for a single request, slow sections and failure points can be isolated. Reconstructed based on OpenTelemetry’s Trace and Span concepts and GenAI conventions. References: OpenTelemetry Trace Overview, GenAI Span Conventions
What OTel does and doesn’t do
OTel’s core role is not to create a screen for viewing data. It provides a common language for applications to generate observability data, connect it within the same context, and transmit it in a vendor-neutral way.
OTel primarily deals with the following signals and connection contexts.
| Component | Simple Meaning | Questions answered in an LLM system |
| — | — | — |
| Trace | The entire path of a single request | Where did it slow down among search, model, and tool? |
| Metric | Numbers aggregated over time | How much did error rate, P95 latency, and token usage change? |
| Log | Detailed record at a specific point in time | What errors and policy decisions occurred? |
| Baggage·Context | Context passed between services | How are records from multiple processes grouped into the same request? |
SDKs or automatic instrumentation generate data within the application. OTLP (OpenTelemetry Protocol) is the common transport rule for sending this data. The OpenTelemetry Collector receives the data, batches it, filters out sensitive attributes, retries, and then exports it to one or more backends.
Therefore, installing OTel alone does not create dashboards and long-term storage. OTel is the instrumentation and transmission layer, while products like Tempo, Loki, and Mimir are the storage and query layers. Separating these boundaries reduces the likelihood of having to completely overhaul application instrumentation code when changing backends.
What to observe in LLMs
LLM monitoring is not about “recording everything,” but about defining the minimum signals needed to explain failures, costs, and quality.
1. End-to-end latency and Time to First Token
Looking only at total response time misses the perceived speed of streaming services. Users may be more sensitive to when the first token or first chunk appeared than when the last token arrived. Therefore, it’s important to separate TTFT (Time to First Token) or time to first chunk from the total operation time.
Current GenAI conventions define attributes and metrics to express operation time, requested model, response model, input/output tokens, and first chunk time for streaming. However, the actual scope of support varies by language and instrumentation library, so don’t assume collection based on name alone; verify it in a sample Trace.
2. Model, Provider, and Fallback Paths
The requested model may differ from the actual response model. A router might have switched to a different provider or a more expensive model due to failure or rate limits. Recording the operation name, provider, requested model, response model, and error type in a Span makes it easier to track “why costs increased even though the success rate is the same?”
Token count is an important ingredient for estimating cost, but the token count itself is not the monetary amount. Prices vary by provider, model, cache policy, and contract, so it’s safer to apply pricing tables and calculation rules in a separate, version-controlled cost layer.
3. RAG Search and Tool Calls
A poor answer isn’t always the model’s fault. Search results might have been empty, an outdated document retrieved, or a tool received incorrect arguments. For RAG, connect search time, number of results, data source, reranking steps, and selected document identifiers. For tool calls, record the tool name, latency, success status, and number of retries.
However, raw documents and tool arguments/results should not be indiscriminately placed in a general Trace storage. This is because personal information, internal secrets, and authentication information can be mixed in. In production environments, it’s more appropriate to store content in a separate, access-controlled storage and leave references or non-identifiable identifiers in the Span.
4. Quality and Safety
OTel is strong at connecting “when, where, and how long this operation executed?” On the other hand, “Is the answer factual?”, “Does it align with the evidence?”, “Is it useful to the user?” require application-specific evaluation criteria.
Therefore, it’s best not to treat observability and evaluation as the same thing. Operate online feedback, offline ground truth datasets, factuality/relevance evaluation, and safety checks separately. By linking evaluation results to Trace or conversation identifiers, you can investigate “what execution path did a low-quality request take?” OTel is less an evaluation engine and more a backbone for connecting different pieces of evidence.
So, is OTel the current standard?
In short, yes, it is for the instrumentation, context propagation, and transmission foundation of observability data. OpenTelemetry grew by integrating the flows of OpenTracing and OpenCensus, and became a CNCF Graduated project in May 2026. Trace and Metric APIs/SDKs for major languages are generally Stable, and a wide range of open-source and commercial backends supporting OTLP and Collector have emerged.
However, this does not mean “all OTel features and all attribute names are permanently fixed.”
- The maturity of log signals varies by language.
- The Collector is in a Mixed state, with varying stability levels for different components.
- GenAI Semantic Conventions for LLMs/agents are evolving in a separate repository, and Span and Event documents still contain Development status.
- The actual support scope for providers and attributes varies by instrumentation library.
Therefore, the practical conclusion is two sentences: It is good to set OTel/OTLP as the common instrumentation and transmission standard for new LLM platforms. However, for gen_ai.* attributes, fix the convention version and library used, and introduce a thin transformation layer between the internal data model and dashboards to prepare for changes.
What is LGTM’s relationship with OTel?
LGTM is an acronym for Loki, Grafana, Tempo, Mimir.
- Loki stores and queries logs.
- Grafana explores and visualizes data from various data sources.
- Tempo stores and queries distributed traces.
- Mimir provides long-term storage for Prometheus-compatible metrics.
In other words, LGTM is not an industry standard that defines the meaning and transmission method of telemetry. It is a combination of Grafana ecosystem backends well-suited for operating data generated by OTel. Even if you choose OpenSearch, Elastic, Jaeger, Prometheus, cloud-managed services, or commercial observability platforms, the OTel layer can be maintained as is.
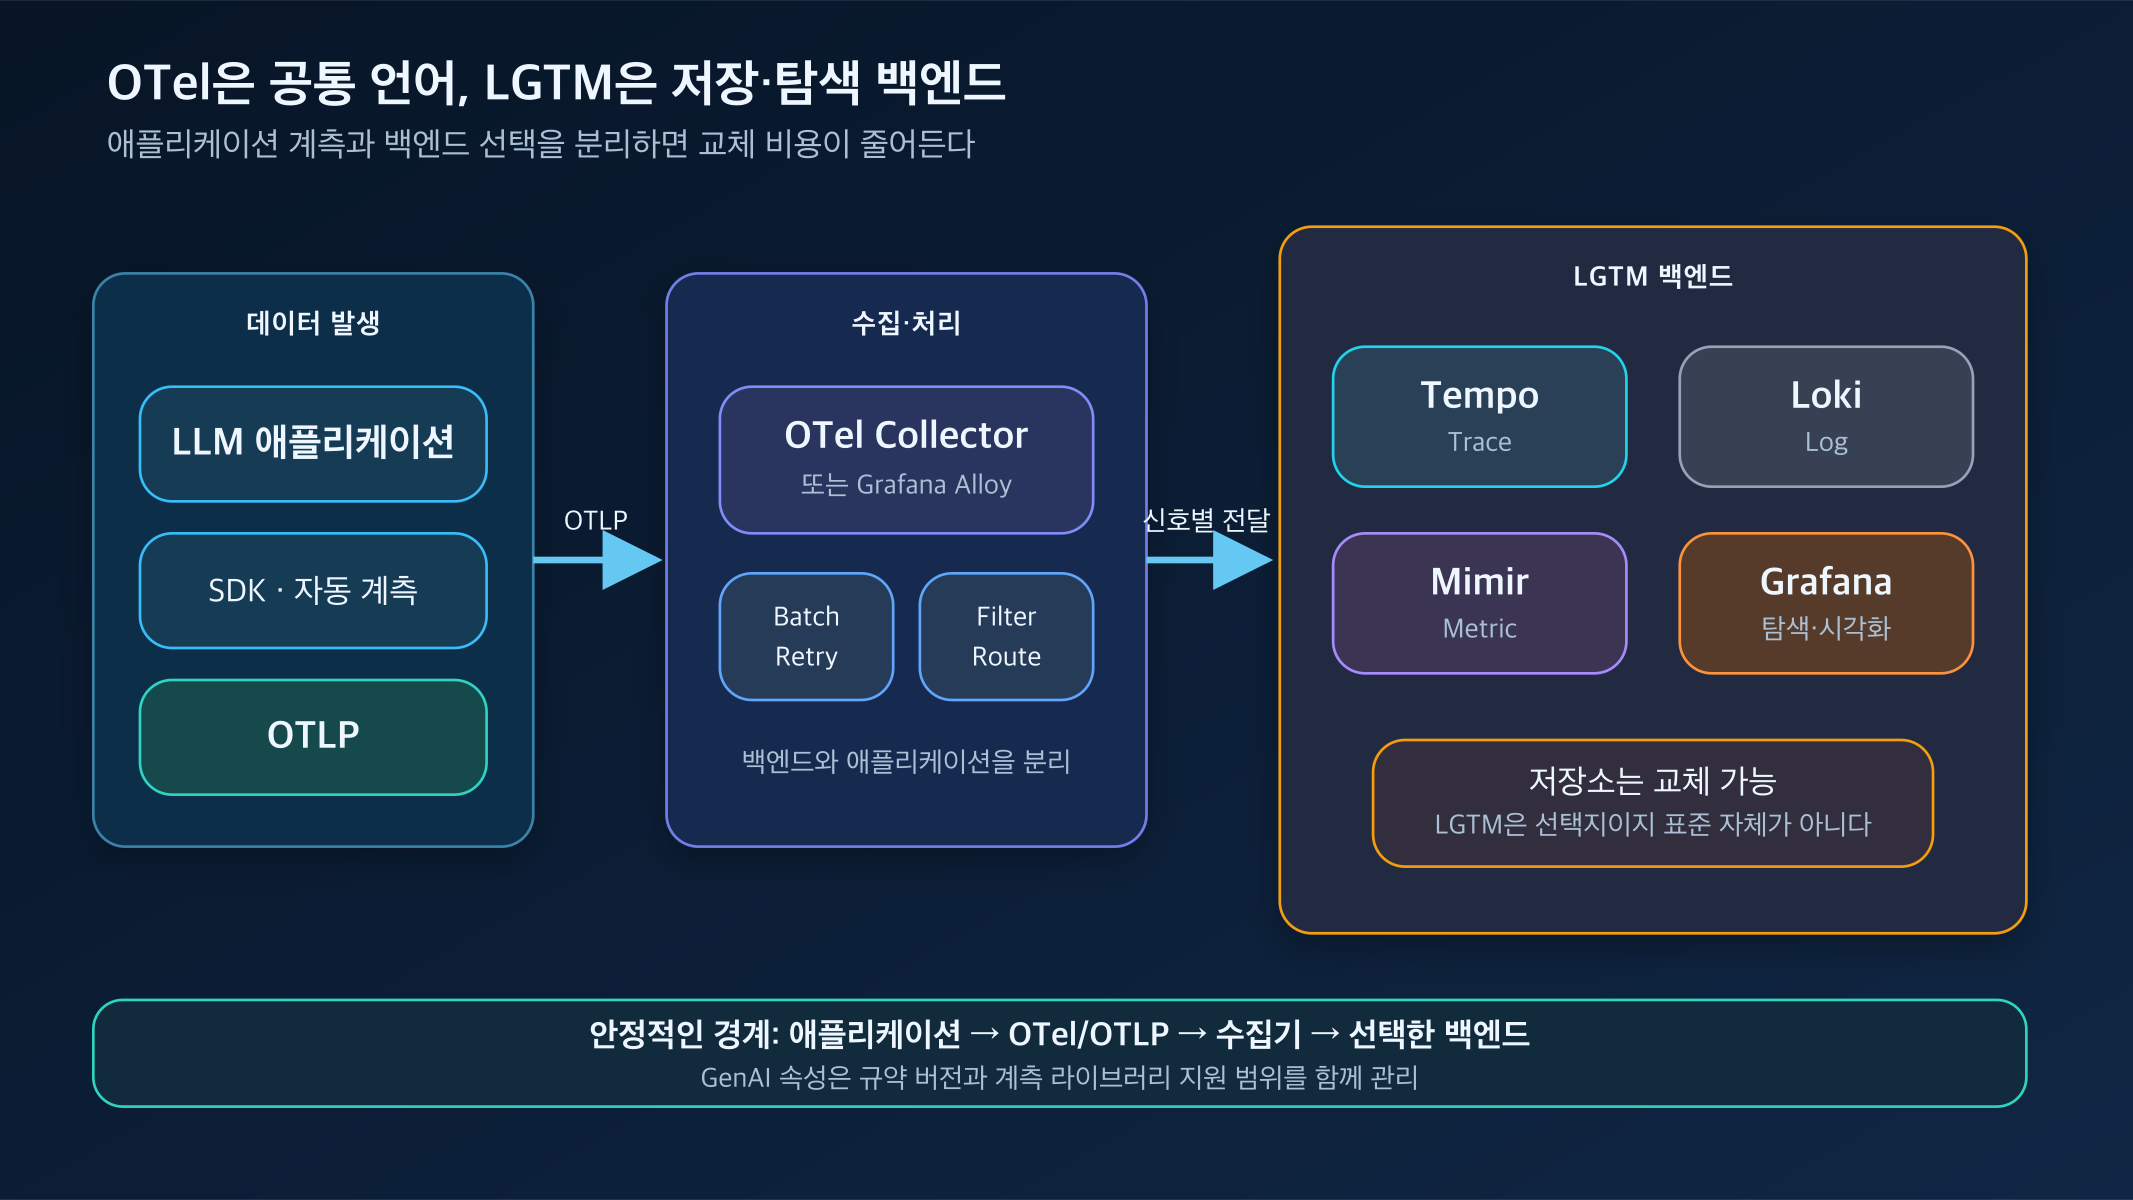
Applications send data via OTLP to a Collector or Alloy, and LGTM handles storage and querying for each signal. Reconstructed based on Grafana official documentation. References: How Grafana Alloy Works, Docker OpenTelemetry LGTM
For the collection layer, you can use a pure OpenTelemetry Collector or Grafana Alloy. Alloy provides a collection pipeline compatible with OpenTelemetry Collector and features from the Prometheus and Loki ecosystems. It’s a natural choice if you operate primarily with Grafana, but it’s not an essential component of OTel.
In development/demo environments, Grafana’s docker-otel-lgtm image allows you to test Collector, Grafana, Loki, Mimir, and Tempo all at once. The official documentation also describes this image for development, demo, and testing purposes, so its configuration should not be directly copied as the definitive solution for large-scale production environments.
What order should you start in for practical implementation?
Storing every prompt and every Span from the beginning will lead to cost and security issues. It’s better to start with small vertical slices like this:
- First, connect service boundaries. Ensure the same Trace context is passed to API Gateway, LLM Orchestrator, Retriever, Model Client, and Tool Runner.
- Define operational questions. Choose metrics that will actually change behavior, such as P95 total latency, time to first response, error rate by model/provider, input/output tokens, fallback rate, and search/tool failure rates.
- Consolidate OTLP egress to one point. Instead of having applications directly know backend addresses, let a Collector or Alloy handle batching, retries, filtering, and routing.
- Connect to LGTM or other backends. Maintain consistent trace_id, service name, and environment attributes to allow navigation from traces to related logs and metrics.
- Validate with actual failures. Intentionally cause model timeouts, search delays, tool errors, and fallbacks to see which Spans they appear in.
- Then, connect quality evaluation. Make it possible to trace back requests with low user ratings or factuality failures to their execution paths.
A dashboard should not be “a place to draw all available data,” but a screen that enables quick operational decisions. For example, a practical structure would be to show user-perceived latency, error rate, token usage, and fallback rate on the first screen, and then drill down into traces to find the root cause among search, model, and tools when an anomaly occurs.
Security and Cost Boundaries to Define First
LLM telemetry can be more sensitive than general web logs. Prompts may contain names, emails, contract information, and source code, and model responses or tool results may include internal data.
OpenTelemetry’s GenAI documentation also advises against collecting system instructions, input messages, and output messages by default, considering them sensitive and large data. It suggests explicitly enabling them only when necessary, and in production environments, storing content in a separate storage with access control, leaving references in the Span.
The following principles should be fixed as policies before adoption:
- Prompt and response bodies are not collected by default.
- Personal information and authentication details are removed by the SDK or Collector.
- High-cardinality values like model/user IDs should not be indiscriminately used as Metric Labels.
- Consider a policy to sample normal requests but preserve errors, high latency, and critical evaluation failures.
- Separate access permissions and retention periods for Trace storage and raw content storage.
- Monitor telemetry loss and Collector’s own failures with separate metrics.
Conclusion
Failures in LLM systems don’t just happen in a single model call. Since search, routing, safety policies, tools, and external APIs collectively create a single answer, operators must be able to view this entire journey as one request.
OTel is currently the safest foundational choice for connecting that journey with a common language. LGTM is a representative combination well-suited for storing and exploring that data with open-source tools. However, the maturity of core OTel should not be over-interpreted as the complete stabilization of GenAI-specific conventions.
The most realistic starting point is to define OTel/OTLP as the platform boundary, manage versions for LLM-specific attributes, and not collect prompt bodies by default. Adhering to these three points allows you to build a reusable monitoring foundation even if you change specific model providers or observability backends.
Official References
- OpenTelemetry Official Site
- OpenTelemetry Trace Concepts
- OpenTelemetry Collector
- OpenTelemetry Language-Specific API/SDK Status
- OpenTelemetry Versioning and Stability Rules
- OpenTelemetry GenAI Semantic Conventions Repository
- GenAI Span Conventions and Input/Output Collection Guidelines
- GenAI Event Conventions
- How Grafana Alloy Works
- Docker OpenTelemetry LGTM
Leave a Reply