Hello everyone! For those exploring the world of Observability, today we’re going to dive into the most crucial concept of the OpenTelemetry Collector: the Pipeline, in an easy-to-understand and detailed manner.
Collecting data, processing it into the desired form, and sending it to where it’s needed – all these processes are made possible by pipelines. Shall we embark on a journey into the world of pipelines together? 😊
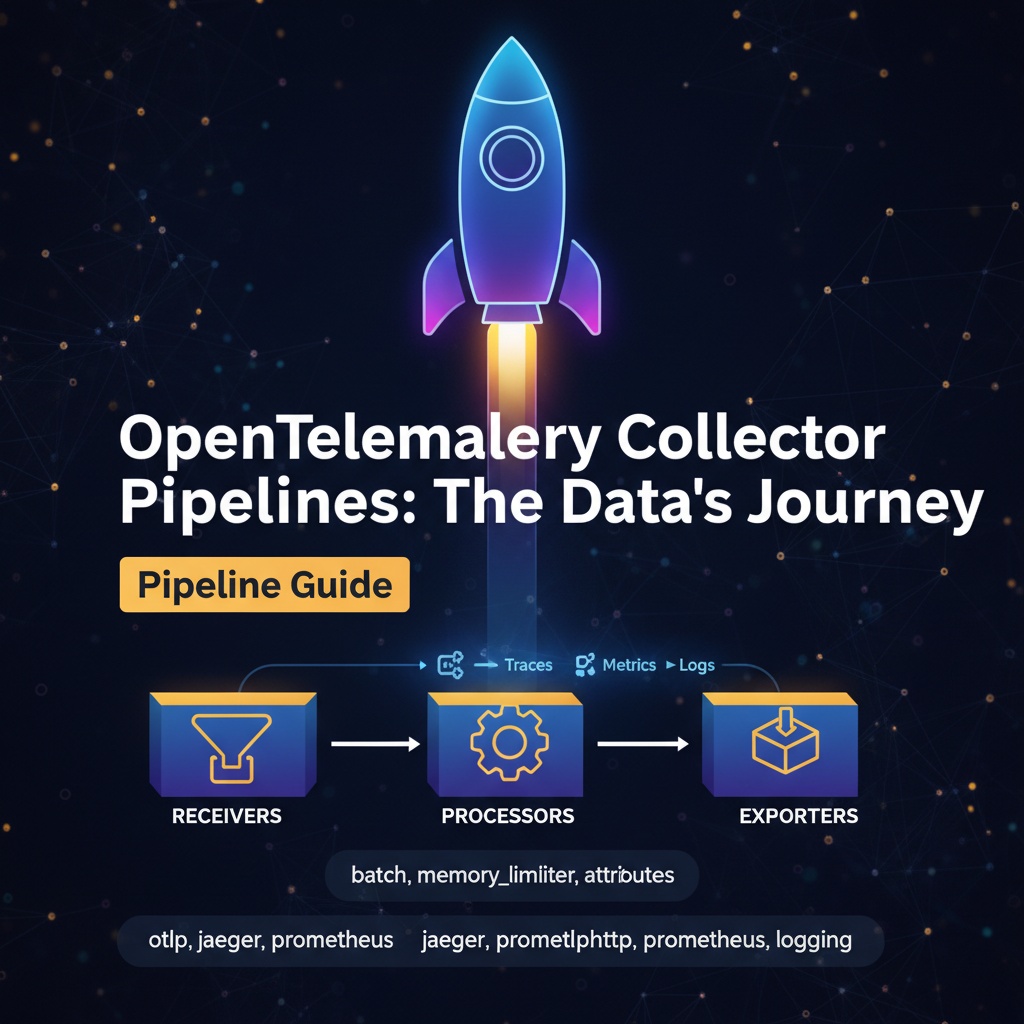
🤔 What is a Pipeline?
In the OpenTelemetry Collector, a pipeline is, in a word, a rule that defines the “journey of data” or the “path of data movement.”
It’s about designing the flow of numerous telemetry data (Traces, Metrics, Logs) generated from applications and infrastructure: where it comes from (receivers), what processes it undergoes (processors), and where it ultimately goes (exporters).
Only by thoroughly understanding and configuring these pipelines can we efficiently manage and analyze the data we need. 🗺️
🧩 3 Core Components of a Pipeline
A pipeline is primarily constructed by connecting three components in sequence: Receivers, Processors, and Exporters.
1. Receivers 📥
- Role: The entry point for collecting telemetry data.
- Description: They are responsible for accepting data from various sources. For example, they can receive data in OTLP (OpenTelemetry Protocol) format, or data from other formats like Jaeger, Prometheus, or Fluentd. The appropriate receiver must be configured depending on the type of data to be received.
- Examples: otlp, jaeger, prometheus, kafka, etc.
2. Processors ⚙️
- Role: The intermediate processing stage for refining and transforming received data.
- Description: Rather than using raw data directly from receivers, it’s often necessary to process it into a more usable form. Processors handle this role. They perform tasks such as filtering data to remove unnecessary information, adding/modifying specific attributes, or grouping multiple data points into batches. This stage helps make data cleaner and more useful.
- Examples: batch, memory_limiter, attributes, etc.
3. Exporters 📤
- Role: The exit point for sending processed data to its final destination.
- Description: They are responsible for transmitting data, once received and processed, to external systems for analysis and visualization. This includes exporting data to backend services for storage or monitoring tools. Data can also be sent to multiple destinations simultaneously.
- Examples: otlp, jaeger, prometheus, logging (for console output), etc.
🔗 Completing the Pipeline by Connecting the Three Elements!
The true power of pipelines lies in how these three elements are connected and combined.
Expressed in a simple flow, it’s as follows:
📥 Receivers ➡️ ⚙️ Processors ➡️ 📤 Exporters
YAML Configuration File Example:
service:
  pipelines:
    traces: # Define pipeline for Traces data
      receivers: [otlp]
      processors: [memory_limiter, batch]
      exporters: [jaeger, otlphttp]
    metrics: # Define pipeline for Metrics data
      receivers: [otlp, prometheus]
      processors: [batch]
      exporters: [prometheus]
In the example above, the traces pipeline receives data via the otlp receiver, passes it through memory_limiter and batch processors, and then sends the data to two exporters: jaeger and otlphttp.
In this way, by defining different pipelines for each data type (traces, metrics, logs) and combining multiple receivers, processors, and exporters as needed, you can create a highly flexible and powerful data processing flow. ✨
✨ Conclusion
Today, we explored pipelines, the core of the OpenTelemetry Collector.
A pipeline is not just a conduit for data; it’s a powerful tool that allows you to freely design data flows by combining three elements: receivers, processors, and exporters. A good understanding of this concept will enable you to manage and utilize the vast amount of data generated by your systems much more efficiently.
We’ll be back with more useful information next time! Thank you. 👋
Leave a Reply