Hello, developers exploring the world of Observability! As OpenTelemetry (OTel) establishes itself as the de facto standard, many of you are likely adopting it. But while using the OTel SDK, have you ever wondered, “What exactly are these internal parts, and how do they work?” 🤔
Today, much like disassembling a car engine, we will delve deeply into the four most important core components that make up the OpenTelemetry SDK.
So, shall we embark together into the engine room of the OTel SDK?
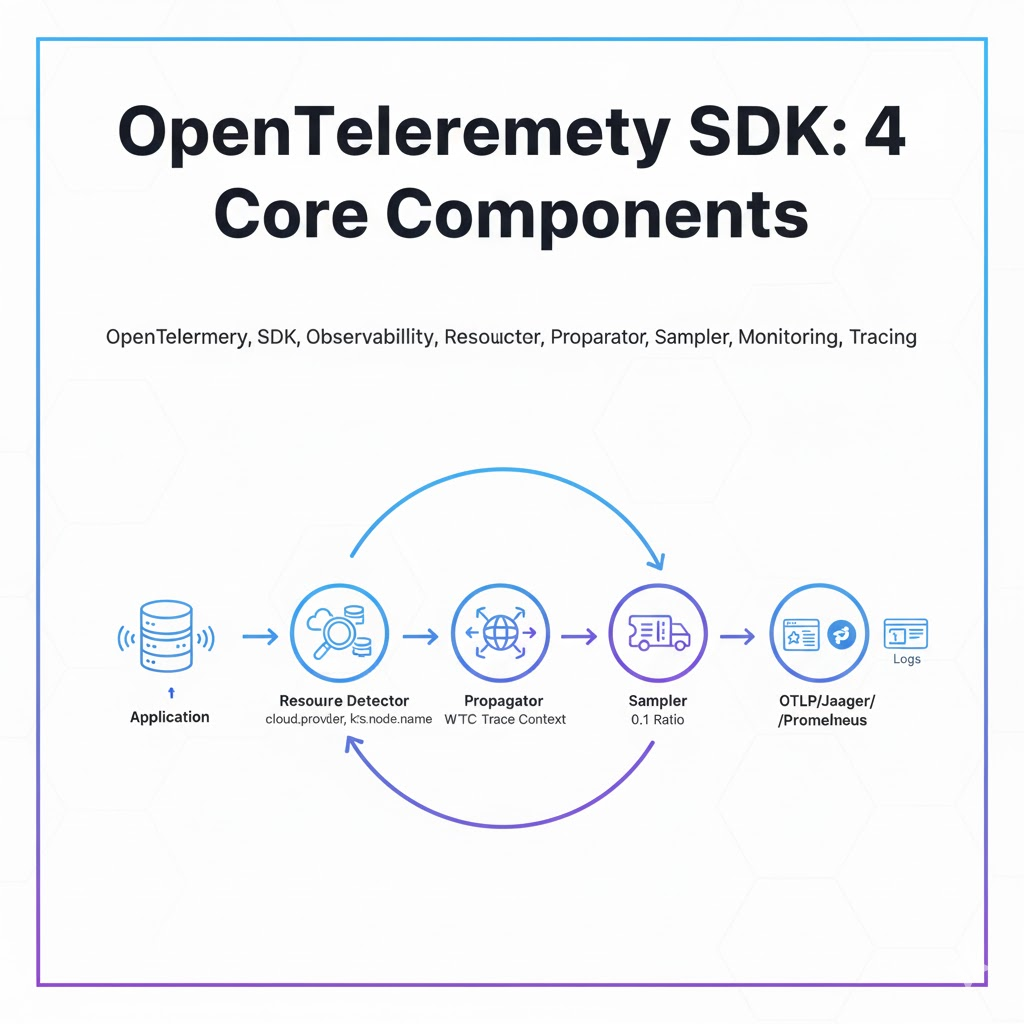
🕵️♀️ Environment Detective: Resource Detector
The Resource Detector is, as its name suggests, a ‘resource detector’. When an application starts, it acts like a detective, thoroughly investigating its surroundings to automatically collect meaningful information. It’s a very smart friend.
- Key Role: It automatically detects environmental information such as where it’s running (AWS, GCP, Azure?), if it’s in a container (Docker, Kubernetes?), and what the host name is. This information is then attached as a common ‘tag’ to all telemetry data (traces, metrics, logs).
- Why is it important?: Thanks to this ‘tag’ information, we can analyze data with much richer context, such as “an error occurred in payment-service v1.2 running in the AWS us-east-1 region.” Knowing the container ID or Pod name allows us to immediately pinpoint the specific instance where the problem occurred.
Examples of information collected by the Resource Detector include:
- Cloud Information: cloud.provider, cloud.region, cloud.account.id
- Container Information: container.name, container.id, container.image.name
- Host Information: host.name, host.arch
- OS Information: os.type, os.version
Since all this information is added automatically, the hassle of manual configuration is greatly reduced.
📬 Context Deliverer: Propagator
The Propagator performs a very important task in distributed systems (MSA): ‘context propagation’.
- Key Role: In an MSA environment, a single request is processed across multiple services (Service A -> Service B -> Service C). The Propagator’s role is to transmit information (Trace ID, Span ID, etc.) that indicates these requests all belong to a single operation (Trace) across service boundaries. It’s like a ‘passport’ for a traveler journeying through multiple countries.
- How it works:
- Inject: When Service A calls Service B, it injects context information, such as traceparent, into HTTP headers or similar locations.
- Extract: When Service B receives the request, it extracts the context information from the headers and recognizes that its operation is a continuation of Service A’s operation.
- Key Standards: It uses agreed-upon formats such as W3C Trace Context (standard) and B3 (commonly used in the past).
Thanks to the Propagator, we can view fragmented Spans scattered across multiple services as a single, beautiful distributed transaction graph.
🎟️ Data Gatekeeper: Sampler
While it would be ideal to trace every request, high-traffic services generate an enormous amount of data, which leads to increased costs. The Sampler exists to solve precisely this problem.
- Key Role: It is responsible for the sampling strategy that determines “which requests to record and which to discard?” In other words, it acts as the ‘gatekeeper’ for data collection.
- Main Strategies:
- AlwaysOnSampler: Records all data. (Useful for development environments)
- AlwaysOffSampler: Discards all data.
- TraceIdRatioBasedSampler: Randomly samples data according to a set ratio (e.g., 10%). (Most common method)
- ParentBasedSampler: If a parent Span is sampled, child Spans are also sampled, following the parent’s decision.
An effective sampling strategy is crucial for reducing costs while ensuring meaningful data is collected to understand the system’s state.
🚚 Final Data Delivery Driver: Exporter
The Exporter is the ‘data delivery driver’ responsible for the very last stage of the SDK pipeline.
- Key Role: It exports telemetry data collected and processed within the application to the final analysis system (Backend).
- Various Destinations: You can choose different Exporters depending on which analysis system you use.
- OTLP Exporter: Uses OpenTelemetry’s standard protocol (OTLP) to send data to OTel Collector, Jaeger, Grafana Tempo, etc. (Most recommended method)
- Jaeger Exporter: Sends data directly in Jaeger format.
- Prometheus Exporter: Exposes metrics in a format that Prometheus can scrape.
- Console Exporter: Prints data to the screen (console). (Best for debugging!)
The Exporter you use determines the final destination of your data.
✨ Summary: The Data Journey
So, let’s summarize how these components work together by following the data’s journey:
- (Start) When the application runs, the Resource Detector collects environmental information and prepares basic ‘tags’. 🕵️♀️
- (Request Reception) When an external request comes in, the Propagator extracts Trace context from HTTP headers, etc. 📬
- (Sampling Decision) When starting a new Trace, the Sampler decides whether or not to record this Trace. 🎟️
- (Data Processing) Spans are created within the application code, and all resource information collected in step 1 is included in these Spans.
- (Data Transmission) The processed data (Span) is delivered to its final destination (e.g., Jaeger) via the Exporter. 🚚
Now, returning to the initial question, the answer is clear. Detecting the properties of the execution environment is the unique mission of the Resource Detector. By clearly understanding the roles of these four components, I am confident that your OpenTelemetry SDK setup and utilization skills will grow to the next level!
Leave a Reply