Hello everyone! Today, I’d like to delve deep into a crucial setting that many tend to overlook while using the OpenTelemetry (OTel) Collector: service::telemetry::metrics.
The OTel Collector plays a vital role in collecting, processing, and transmitting all data from our systems! But is this important Collector itself operating well? 🤔 Could data be disappearing midway? Is the Collector struggling?
The answer to these questions can be found in the service::telemetry::metrics setting.
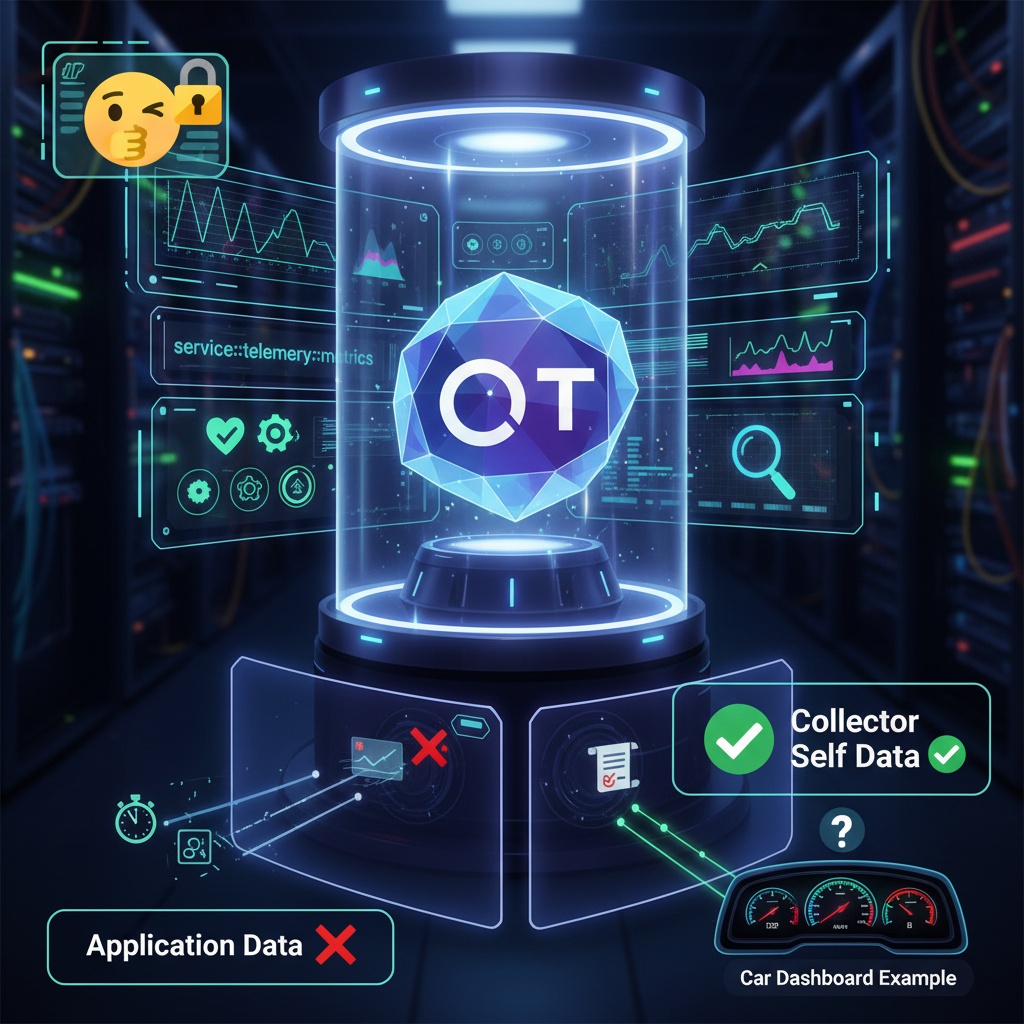
🧐 service::telemetry::metrics, who are you?
Simply put, this setting defines how to expose “metrics that indicate the health and performance of the OpenTelemetry Collector itself” externally.
Many focus solely on collecting application metrics through the Collector, but often forget to monitor the state of the Collector that processes that data. service::telemetry::metrics acts as a crucial window into the Collector’s internal workings. 🖼️
- Application Data (❌): This is not traces, metrics, or logs generated by your service or app.
- Collector’s Own Data (✅): This is data indicating how busy the Collector is, how healthy it is, and what’s happening internally.
It’s easy to understand if you think of it like a car’s dashboard, which shows the car’s own status, such as engine temperature, remaining fuel, and driving speed. 🚗💨
🩺 What health information can you get?
Activating service::telemetry::metrics provides detailed internal information about the Collector, such as:
- 📈 Data Throughput:
- How many spans, metrics, and logs the Receiver is receiving per second.
- How much data the Exporter is sending out externally per second.
- 📦 Queue Status:
- How much of the Processor’s or Exporter’s queue is being used (Queue Usage).
- Whether data is being dropped because the queue is full (Dropped Data Points).
- 🚦 Data Transmission Success/Failure:
- Whether the Exporter successfully sent data to external systems (e.g., Prometheus, Jaeger) or failed.
- Provides clues to understand why it failed, if it did.
- ⚙️ Collector Process Information:
- CPU and memory usage of the Collector process itself.
- Go runtime-related information (e.g., garbage collection).
✨ Why is this so important?
Monitoring the Collector’s own metrics offers tremendous benefits:
- Troubleshooting 🔧 You can quickly identify the cause in situations like, “I definitely sent data from the application, but it’s not showing up on the dashboard!” By checking the Collector’s
dropped_spansmetric, you can immediately tell if the Collector is dropping data. - Performance Tuning 🚀 If queue usage consistently stays above 90%, it’s a sign that the Collector is reaching its processing capacity limit. This provides a basis for taking action, such as increasing the Collector’s resources or scaling out to multiple instances. You can detect bottlenecks early and maintain optimal performance.
- Building a Robust and Stable Pipeline If the Collector, which is the core of the Observability pipeline, is unstable, the reliability of the entire monitoring system decreases. By continuously monitoring the Collector’s health, you can proactively respond before failures occur and build a stable data pipeline.
🛠️ How do I set it up?
The setup is very simple. Just add the following under the service section of your config.yaml file:
service:
  # ... other pipeline settings ...

  telemetry:
    metrics:
      # Systems like Prometheus scrape Collector metrics from this address and port.
      address: 0.0.0.0:8888

      # Determines the level of detail for metrics. (basic, normal, detailed)
      # 'detailed' is recommended for in-depth analysis.
      level: detailed
After configuring this and running the Collector, you can check various internal metrics in Prometheus format via the http:// endpoint.
Conclusion
service::telemetry::metrics is not just a simple configuration option; it’s an essential feature for keeping the OTel Collector, the heart of our observability pipeline, healthy and stable.
The Collector acts as the eyes and ears of our system; now, don’t forget to give it a thorough health check! 😊
Leave a Reply