In the previous article, we explained that connecting Logs, Traces, and Metrics is essential to understand both the scope and root cause of security incidents. So, what path do the three signals generated by an application take to reach the observability backend? OpenTelemetry and Grafana Alloy are names that frequently appear together in this context.
OpenTelemetry, or OTel for short, is a vendor-neutral specification and tool ecosystem for creating, representing, and transmitting observability signals. Grafana Alloy is a Collector distribution within that ecosystem, an executable program that receives and processes signals from various sources before sending them to their destination. To put it in one sentence, if OpenTelemetry is the common transportation rule, Alloy is the transfer hub that understands those rules.
This article will walk through a minimal hands-on exercise where an application sends signals via OTLP, and Alloy, running in Podman, receives, processes, and forwards them. The exercise will only confirm local debug output, and finally, we will point out security and disaster recovery considerations that must be addressed in a production environment. Product behavior and examples were verified based on official documentation as of September 3, 2026.
OpenTelemetry and Alloy are Not the Same Thing
OpenTelemetry is not a single server product. It is a project that bundles various elements such as APIs, SDKs, automatic instrumentation, data models, Semantic Conventions, OTLP (OpenTelemetry Protocol), and Collectors. Application SDKs create Spans, Metrics, and Log Records, describe which service and environment they originated from using Resource attributes, and connect request relationships between services with Trace Context.
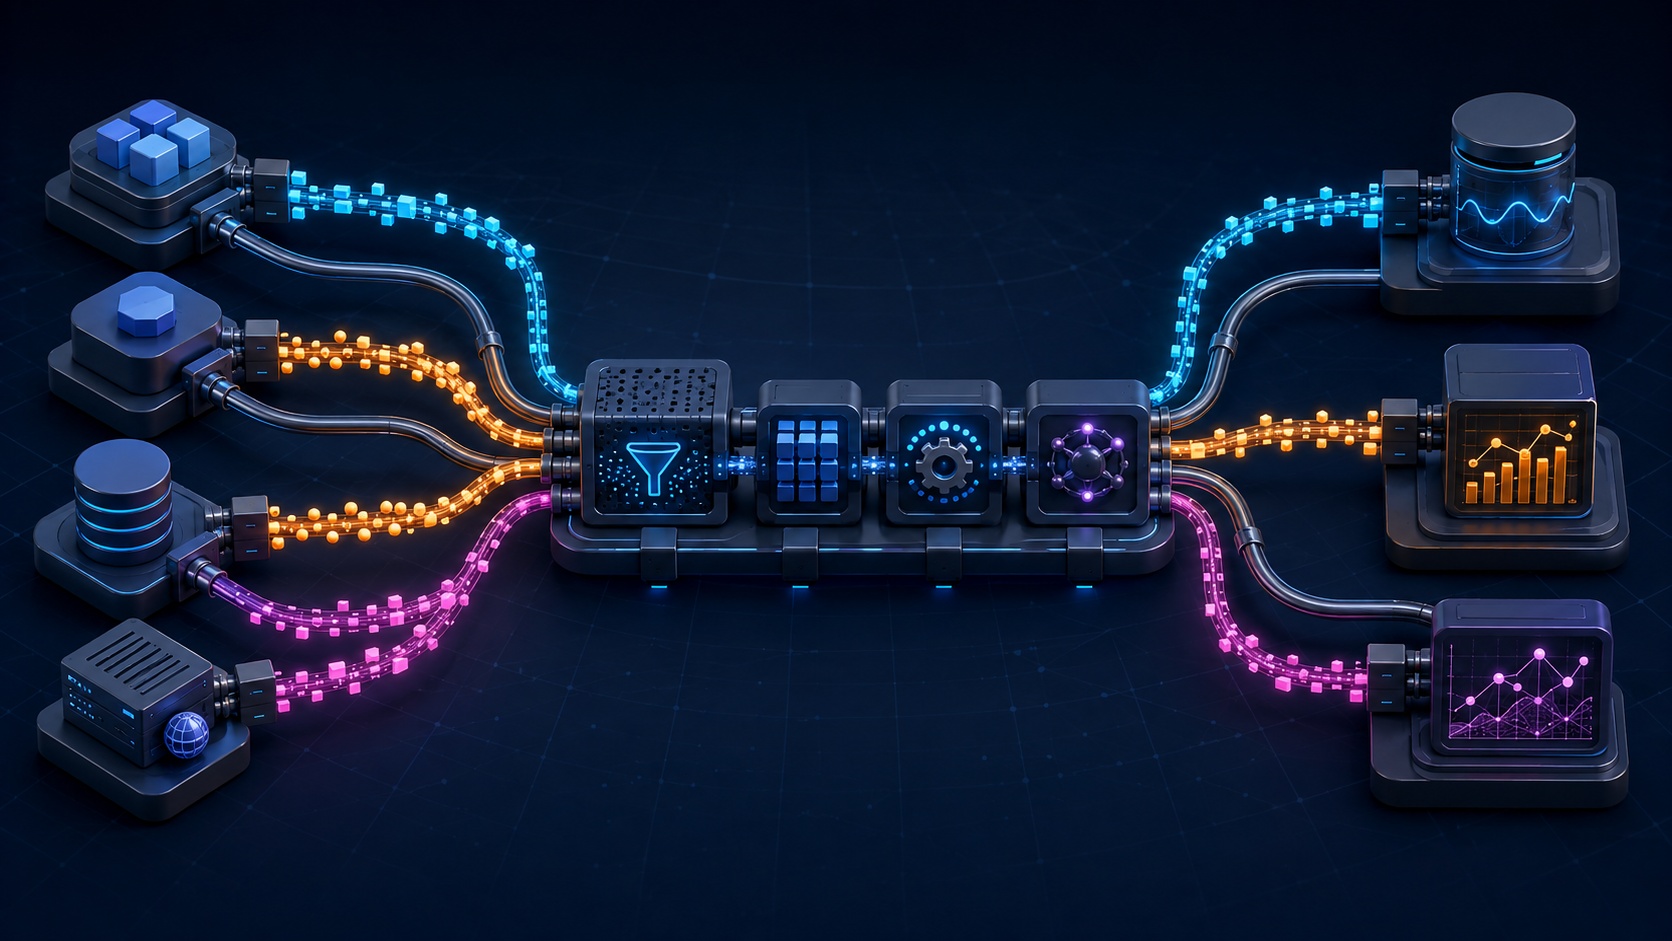
The OpenTelemetry Collector is a vendor-neutral proxy that connects Receivers (which receive these signals), Processors (which transform and filter them), and Exporters (which send them out) into a pipeline. Storage and querying are not the Collector’s primary tasks. Actual storage and search are handled by Backends such as Tempo, Mimir, Loki, Jaeger, Prometheus, or commercial services that receive OTLP.
Grafana Alloy is officially described as an OpenTelemetry Collector distribution that also provides Prometheus pipeline and Grafana ecosystem connectivity features for Loki, Pyroscope, and more. Although it bears the Grafana product name, it can also send data to other compatible Backends. Conversely, using OTel does not make Alloy mandatory. You can choose an upstream Collector or another distribution.
| Category | OpenTelemetry | Grafana Alloy | Observability Backend |
| — | — | — | — |
| Identity | Specification, API, SDK, Protocol, Collector Ecosystem | Executable distribution based on OTel Collector | Storage, Search, Visualization System |
| Main Role | Standardize signal generation methods, data representation, and transmission | Receive, Transform, Filter, Batch, Route, Export | Long-term storage, Querying, Dashboards, Alerts |
| Must be used together? | Other Collectors besides Alloy can be chosen | Supports Prometheus/Loki-family components in addition to OTel | Can be replaced based on requirements |
| Boundary to remember | OTel is not a single storage solution | Alloy is not an analysis screen or authorization ledger | Backend does not replace instrumentation code |
The Full Path of a Single Signal
For example, let’s say a payment API processes one request. The OTel SDK creates a Span containing a Resource named “checkout-api” and a TraceId. The Exporter sends this to Alloy via OTLP/gRPC or OTLP/HTTP. Alloy’s OTLP Receiver receives it, the Memory Limiter controls excessive memory usage, and the Batch Processor bundles multiple records to reduce transmission frequency. Finally, the Exporter delivers it to the selected Backend.
애플리케이션 계측
  → OTLP/gRPC 또는 OTLP/HTTP
  → Alloy OTLP Receiver
  → Memory Limiter
  → Batch Processor
  → Exporter
  → Tempo·Mimir·Loki 또는 다른 호환 Backend
What’s important here is not “putting three signals in one place,” but rather maintaining the same correlation context, such as service name, environment, and TraceId. Logs and Traces that are unrelated will not automatically connect just because they pass through a Collector. Context must be properly generated and propagated during the instrumentation phase.
OTLP supports gRPC and HTTP transmission methods. Generally, gRPC reception port is 4317, and HTTP reception port is 4318. However, the fact that a port is open does not imply authentication and encryption. When receiving from outside the network boundary, TLS, authentication, and access control must be designed separately.
Why Applications Don’t Send Directly to the Backend
In small development environments, SDKs can export directly to the Backend. Official OpenTelemetry documentation also describes direct transmission as a possible option for initial stages. However, if each service includes Backend addresses and authentication methods, the scope of changes becomes large, and retry, batch, and filter policies are scattered across applications.
By introducing a Collector layer, applications can quickly hand off signals to a nearby OTLP Endpoint and return to their primary tasks. Retries, batching, sensitive data filtering, and routing to multiple destinations are managed by the Collector. However, since the Collector can become a new bottleneck and point of failure, queue backlog, number of rejected/discarded items, memory usage, and Exporter failures must be observed.
The placement of batching is also important. Grafana documentation strongly recommends configuring Batch Processor for all Alloy instances using OTel components and advises placing it after processors that can discard data, such as Memory Limiter and sampling. This ensures that the remaining data can be efficiently bundled.
Hands-on: Opening an Alloy Transfer Hub in Podman
This exercise does not use an external Backend or cloud credentials. It is a closed-loop verification where data received via OTLP is output to container logs by Alloy’s Debug Exporter. Do not send sensitive operational data; use only sample signals.
Step 1: Prepare Working Directory and Configuration File
Create config.alloy in a new directory.
mkdir -p alloy-lab
cd alloy-lab
logging {
level = "info"
format = "logfmt"
}
otelcol.receiver.otlp "lab" {
grpc {
endpoint = "0.0.0.0:4317"
}
http {
endpoint = "0.0.0.0:4318"
}
output {
metrics = [otelcol.processor.memory_limiter.lab.input]
logs = [otelcol.processor.memory_limiter.lab.input]
traces = [otelcol.processor.memory_limiter.lab.input]
}
}
otelcol.processor.memory_limiter "lab" {
check_interval = "1s"
limit = "256MiB"
output {
metrics = [otelcol.processor.batch.lab.input]
logs = [otelcol.processor.batch.lab.input]
traces = [otelcol.processor.batch.lab.input]
}
}
otelcol.processor.batch "lab" {
timeout = "1s"
send_batch_size = 512
output {
metrics = [otelcol.exporter.debug.lab.input]
logs = [otelcol.exporter.debug.lab.input]
traces = [otelcol.exporter.debug.lab.input]
}
}
otelcol.exporter.debug "lab" {
verbosity = "detailed"
}This configuration is a directed graph: Receiver → Memory Limiter → Batch → Debug Exporter. The Alloy native engine connects the output of one component to the input of the next using Alloy syntax, not YAML. As of September 2026, there is an `alloy otel` engine that directly executes upstream Collector YAML, but it is marked Experimental in the official documentation, so this exercise uses the stable native engine.
Step 2: Validate Configuration First
Before running, use the container’s `validate` command to check syntax and component connections. Replace
podman run --rm
  -v "$PWD/config.alloy:/etc/alloy/config.alloy:Z,ro"
  docker.io/grafana/alloy:v1.19.0
  validate /etc/alloy/config.alloy
If successful, it will exit without configuration errors. If it fails, check the line number and component name and do not proceed to the next step.
Step 3: Run Alloy
podman run --rm -d --name alloy-lab
  -p 127.0.0.1:12345:12345
  -p 127.0.0.1:4317:4317
  -p 127.0.0.1:4318:4318
  -v "$PWD/config.alloy:/etc/alloy/config.alloy:Z,ro"
  docker.io/grafana/alloy:v1.19.0
  run --server.http.listen-addr=0.0.0.0:12345
  --storage.path=/var/lib/alloy/data
  /etc/alloy/config.alloy
The reason for limiting host binding to 127.0.0.1 is to prevent exposing the unauthenticated OTLP Receiver and debug UI for the exercise to the outside. Open http://127.0.0.1:12345 in a browser to check component status and connection graph.
Step 4: Instrument a Sample App with Just a Prompt
Enter the following prompt into your LLM coding tool. Before running the generated code, review the file list and dependencies, and ensure there are no secret values or external transmission addresses.
Create a minimal HTTP server in Python. Use the official OpenTelemetry SDK and OTLP Exporter, and set the service name to `alloy-lab-app`. When a `/work` request is received, create one parent Span, one child Span, one Counter Metric, and one structured Log containing a TraceId, then send them via OTLP/HTTP to `http://127.0.0.1:4318`. Include the necessary `requirements.txt`, execution command, and request command, but do not use external services or credentials.
Verify that the generated output matches the official package names for the language and current API, then run it in an isolated virtual environment. Call `/work` a few times and then view the Alloy output with the following command.
podman logs -f alloy-labThe expected result is that the `alloy-lab-app` Resource and the created Span, Metric, and Log Record appear in the Debug Exporter output. Compare TraceIds to confirm that signals from a single request are connected. Debug output is for learning purposes and not suitable for high-volume operational traffic.
Step 5: Stop and Clean Up
When the exercise is complete, stop it as follows. The `–rm` option will also remove stopped containers.
podman stop alloy-labWhat Changes When Switching to a Backend
By replacing the Debug Exporter in the exercise with an OTLP Exporter, you can connect a real Backend behind Alloy. You can send all three signals to a single OTLP-supporting Endpoint, or route Logs to Loki, Traces to Tempo, and Metrics to a Prometheus-compatible storage, differently.
At this point, the Endpoint, protocol, and authentication method must follow the Backend’s documentation. For example, `otelcol.exporter.otlphttp` corresponds to HTTP/HTTPS Endpoints, and `otelcol.exporter.otlp` to gRPC Endpoints. Do not write API Tokens in plain text in configuration files; use environment variables or your organization’s Secret management system. In environments shared by multiple Tenants, enforce reception authentication and Tenant identification at a trusted Gateway, and do not blindly trust Tenant attributes sent by clients.
| Deployment Method | Advantages | Considerations | Suitable Environment |
| — | — | — | — |
| Direct transmission from application to Backend | Fewer components, quick start | Authentication, retries, destination settings scattered per service | Personal development, short verification |
| Agent per host | Close to application, can hand off quickly | Requires deployment/updates for each node | VM, Kubernetes DaemonSet |
| Central Gateway | Manage policies and Exporters in one place | Requires bottleneck/single point of failure/tenant isolation | Platform shared by multiple teams |
| Agent + Gateway | Separate local collection and central policy | Requires capacity/disaster recovery for both layers | Large-scale production environment |
Security and Reliability Checklist Before Going to Production
- Bind OTLP Receiver and Alloy management UI only to necessary interfaces and networks.
- Apply TLS and authentication for connections between Collectors or remote clients.
- Do not include Tokens, sessions, or personal information in Log bodies, Span Attributes, or Resource Attributes.
- Apply filters and masking as close to the instrumentation source as possible, not just once before export.
- Adjust Memory Limiter, Batch, transmission queues, and retries according to traffic characteristics.
- Monitor reception volume, rejection/discard volume, queue backlog, export failures, restart counts, and memory.
- Define organizational standards for Resource attributes like service name and environment name, and do not overuse high-cardinality values as Metric Labels.
- Fix container versions or digests, mount configurations as read-only, and run with minimum privileges.
- Disable Debug Exporter in production as it can expose raw data in its detailed output.
- Conduct failure experiments to simulate Backend delays/outages and assess data loss and application impact.
Telemetry can contain user identifiers, URLs, queries, error details, and internal network structures. OpenTelemetry’s official security documentation also cites PII exposure, data tampering, compliance, and DoS as key reasons for Collector security. The observability pipeline is also a data pipeline that needs protection.
Conclusion: Understand the Standard and the Transport Program Separately
OpenTelemetry is a standard and ecosystem that enables Logs, Traces, and Metrics to be created, connected, and transmitted in a common way. Grafana Alloy is a Collector distribution that actually receives, processes, and routes those signals. OTel is not a Backend, Alloy is not a Grafana-exclusive channel, and simply having a Collector does not automatically ensure correlation and security.
The smallest starting point is a local OTLP Receiver and Debug Exporter. After confirming the Resource, TraceId, and arrival of the three signals, replace the Debug Exporter with a real Backend Exporter while retaining the Memory Limiter and Batch. The next step can explore how to query signals arriving at Tempo, Loki, and Prometheus-family storage by navigating between them in Grafana.
Official References
- OpenTelemetry Components
- OpenTelemetry Collector
- OpenTelemetry Collector Components
- OpenTelemetry Security
- Grafana Alloy Introduction
- OpenTelemetry in Grafana Alloy
- Alloy OTLP Receiver
- Alloy Memory Limiter Processor
- Alloy Batch Processor
- Run Alloy with Docker Containers
Category: Cloud/opentelemetry
Tags: OpenTelemetry, Grafana Alloy, OTLP, Observability, Collector, Log, Trace, Metric
Leave a Reply