OpenTelemetry (OTel) is a standardized set of tools, APIs, and SDKs designed to achieve observability in distributed systems. All valuable data generated here (traces, metrics, logs) is transmitted to collection servers via a standard protocol called OTLP (OpenTelemetry Protocol). One of the transmission formats for OTLP is none other than JSON! 📜
Today, we will delve into how the three core data types collected by OTel are structured in OTLP JSON format, exploring the in-depth structure of their raw data with examples. Understanding this structure will significantly enhance your data analysis and processing capabilities! 💪
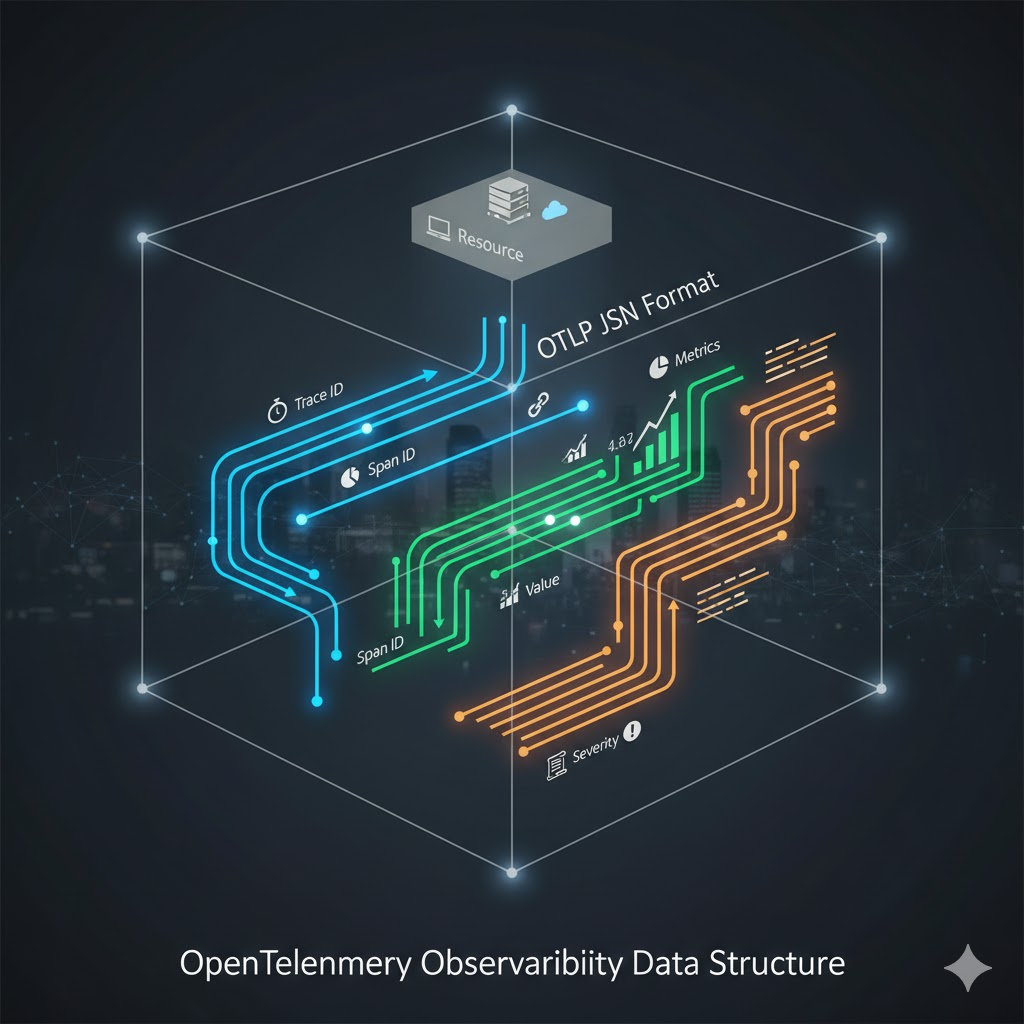
🔍 Understanding the Common Hierarchical Structure of OTLP Data
OTLP data, regardless of whether it’s traces, metrics, or logs, shares a common hierarchical structure. This is to clearly separate and convey information about the environment that generated the data.
| Data Type | Root Object | Key Sub-fields | Data Content |
| — | — | — | — |
| Trace | “resourceSpans” | “scopeSpans”, “spans” | Execution flow of a single request |
| Metric | “resourceMetrics” | “scopeMetrics”, “metrics” | System performance and numerical data |
| Log | “resourceLogs” | “scopeLogs”, “logRecords” | Application log messages |
🌳 1. Resource Block (Top-level Identifier)
All OTLP data includes a resource block. This is used to identify the entity (service, host, etc.) that generated the data. In other words, it’s crucial information that tells us where this data originated.
- “attributes”: Contains environmental information as key-value pairs, such as service name (service.name), instance ID (service.instance.id), and cloud information (cloud.provider).
📦 2. Scope/Instrumentation Library Block
Immediately below the resource block is the scope or instrumentation library block.
- “scope”: Specifies which library or version was used to collect this data. Example: io.opentelemetry.instrumentation.http, version 1.27.0.
📊 1. Comprehensive Analysis of Trace Data Structure (OTLP Trace JSON)
Trace data tracks all steps a single request goes through as it traverses a system. The core element is the Span.
{
  "resourceSpans": [
    {
      "resource": {
        "attributes": [
          { "key": "service.name", "value": { "stringValue": "checkout-service" } },
          { "key": "service.instance.id", "value": { "stringValue": "627cc493-f310-47de-96bd-71410b7dec09" } },
          { "key": "cloud.provider", "value": { "stringValue": "aws" } },
          { "key": "host.id", "value": { "stringValue": "ip-172-31-12-55" } }
        ]
      },
      "scopeSpans": [
        {
          "scope": {
            "name": "io.opentelemetry.instrumentation.http",
            "version": "1.27.0"
          },
          "spans": [
            {
              "traceId": "4bf92f3577b34da6a3ce929d0e0e4736",
              "spanId": "00f067aa0ba902b7",
              "name": "HTTP POST /checkout",
              "kind": "SPAN_KIND_SERVER",
              "startTimeUnixNano": "1729123548123456789",
              "endTimeUnixNano": "1729123549223456789",
              "attributes": [
                { "key": "http.method", "value": { "stringValue": "POST" } },
                { "key": "http.status_code", "value": { "intValue": 200 } },
                { "key": "net.peer.ip", "value": { "stringValue": "10.10.1.12" } },
                { "key": "user.id", "value": { "stringValue": "abcd-123" } }
              ],
              "events": [
                {
                  "timeUnixNano": "1729123548156789000",
                  "name": "db.query.start",
                  "attributes": [
                    { "key": "db.statement", "value": { "stringValue": "SELECT * FROM orders WHERE id=42" } }
                  ]
                }
              ],
              "links": [
                {
                  "traceId": "4bf92f3577b34da6a3ce929d0e0e4736",
                  "spanId": "2233445566778899",
                  "attributes": [
                    { "key": "linked.operation", "value": { "stringValue": "payment-processing" } }
                  ]
                }
              ],
              "status": { "code": "STATUS_CODE_OK", "message": "completed successfully" }
            }
          ]
        }
      ]
    }
  ]
}
✨ Detailed Explanation of Key Fields
| Field | Description | Example Value |
| — | — | — |
| “traceId” | Unique ID identifying the entire transaction. | 4bf92f3577b34da6a3ce929d0e0e4736 |
| “spanId” | Unique ID identifying the current operational step. | 00f067aa0ba902b7 |
| “name” | Name of the operation represented by the span. | HTTP POST /checkout |
| “kind” | Type of span (server, client, internal, etc.). | SPAN_KIND_SERVER |
| “startTimeUnixNano”, “endTimeUnixNano” | Start and end time of the operation (nanoseconds). ⏱️ | 1729123548… |
| “attributes” | Additional detailed information related to the span (HTTP method, status code, user ID, etc.). | http.method: POST |
| “events” | Records of specific events that occurred during span execution (log messages, DB query start, etc.). | name: db.query.start |
| “links” | Information linking this span to other traces/spans (useful for distributed tracing). 🔗 | linked.operation: payment-processing |
| “status” | Result of the span’s execution (success/error code and message). | code: STATUS_CODE_OK |
> Example Highlight: Shows a DB query event (db.query.start) occurring during an HTTP POST request processing (traceId: 4bf92f…) by the checkout-service, ultimately succeeding (STATUS_CODE_OK).
📈 2. Comprehensive Analysis of Metric Data Structure (OTLP Metrics JSON)
Metric data represents system performance or status numerically over time. It exists in various forms such as Gauge, Sum, and Histogram.
{
  "resourceMetrics": [
    {
      "resource": {
        "attributes": [
          { "key": "service.name", "value": { "stringValue": "checkout-service" } },
          { "key": "service.version", "value": { "stringValue": "1.5.2" } },
          { "key": "host.name", "value": { "stringValue": "ip-172-31-12-55" } }
        ]
      },
      "scopeMetrics": [
        {
          "scope": {
            "name": "io.opentelemetry.runtime",
            "version": "1.27.0"
          },
          "metrics": [
            {
              "name": "request_duration_seconds",
              "description": "HTTP request duration",
              "unit": "s",
              "sum": {
                "dataPoints": [
                  {
                    "attributes": [
                      { "key": "http.method", "value": { "stringValue": "POST" } },
                      { "key": "http.status_code", "value": { "intValue": 200 } }
                    ],
                    "startTimeUnixNano": "1729123548123456000",
                    "timeUnixNano": "1729123549223466000",
                    "value": 0.154,
                    "flags": 1
                  }
                ],
                "aggregationTemporality": "AGGREGATION_TEMPORALITY_DELTA",
                "isMonotonic": false
              }
            },
            {
              "name": "system.cpu.utilization",
              "description": "CPU usage percentage",
              "unit": "%",
              "gauge": {
                "dataPoints": [
                  {
                    "attributes": [
                      { "key": "host.id", "value": { "stringValue": "ip-172-31-12-55" } }
                    ],
                    "timeUnixNano": "1729123549123459999",
                    "value": 73.4
                  }
                ]
              }
            }
          ]
        }
      ]
    }
  ]
}
✨ Detailed Explanation of Key Fields
| Field | Description | Example Value |
| — | — | — |
| “name”, “description”, “unit” | Metric name, description, and unit of measurement. | request_duration_seconds, s |
| “sum”, “gauge” | The type of metric and the block containing its value. | sum (cumulative total), gauge (instantaneous value) |
| “dataPoints” | List of actual measured data values. | 📝 |
| dataPoints.”attributes” | Tags/filtering information specific to that measurement (e.g., HTTP method, status code). | http.status_code: 200 |
| dataPoints.”value” | The actual numerical value measured. | 0.154 (seconds), 73.4 (%) |
| dataPoints.”timeUnixNano” | Time when the measurement was collected. ⏰ | 1729123549… |
| sum.”aggregationTemporality” | Aggregation method for sum measurements (delta: difference from previous interval, cumulative: sum from start). | AGGREGATION_TEMPORALITY_DELTA |
> Example Highlight: Shows that request processing time (request_duration_seconds) was measured as a sum of 0.154 seconds, and system CPU utilization (system.cpu.utilization) was measured as a gauge of 73.4%.
📝 3. Comprehensive Analysis of Log Data Structure (OTLP Logs JSON)
Log data consists of text-based messages that record events occurring in an application. OTel enhances their utility by linking tracing information to logs.
{
  "resourceLogs": [
    {
      "resource": {
        "attributes": [
          { "key": "service.name", "value": { "stringValue": "checkout-service" } },
          { "key": "service.namespace", "value": { "stringValue": "web-shop" } },
          { "key": "host.id", "value": { "stringValue": "ip-172-31-12-55" } }
        ]
      },
      "scopeLogs": [
        {
          "scope": {
            "name": "io.opentelemetry.logger",
            "version": "1.27.0"
          },
          "logRecords": [
            {
              "timeUnixNano": "1729123548123456789",
              "observedTimeUnixNano": "1729123548125456789",
              "severityText": "INFO",
              "severityNumber": 9,
              "body": { "stringValue": "Order ID 42 successfully processed" },
              "attributes": [
                { "key": "order.id", "value": { "intValue": 42 } },
                { "key": "user.id", "value": { "stringValue": "abcd-123" } },
                { "key": "event.name", "value": { "stringValue": "order_completed" } }
              ],
              "traceId": "4bf92f3577b34da6a3ce929d0e0e4736",
              "spanId": "00f067aa0ba902b7",
              "flags": 1
            },
            {
              "timeUnixNano": "1729123549223456000",
              "severityText": "ERROR",
              "severityNumber": 17,
              "body": { "stringValue": "Payment gateway timeout error" },
              "attributes": [
                { "key": "payment.processor", "value": { "stringValue": "stripe" } },
                { "key": "error.code", "value": { "intValue": 504 } }
              ],
              "traceId": "7aa111223344556677889900aabbccdd",
              "spanId": "11aabbccddeeff00",
              "flags": 1
            }
          ]
        }
      ]
    }
  ]
}
✨ Detailed Explanation of Key Fields
| Field | Description | Example Value |
| — | — | — |
| “timeUnixNano”, “observedTimeUnixNano” | Time when the log was generated and time when the collector observed it. | 1729123548… |
| “severityText”, “severityNumber” | Log severity level (text and numerical). | INFO (9), ERROR (17) |
| “body” | Actual log message content. | Order ID 42 successfully processed |
| “attributes” | Additional information related to the log message. | order.id: 42, user.id: abcd-123 |
| “traceId”, “spanId” | The IDs of the trace and span that caused this log. (Observability core!) 🧩 | 4bf92f35…, 00f067aa… |
> Example Highlight: An order success log (severityText: INFO) is linked to a specific trace/span ID. Additionally, a payment gateway error log (severityText: ERROR) is also recorded with severity level 17.
💡 Summary and Conclusion
OpenTelemetry’s OTLP JSON format bundles all observability data into a standardized hierarchical structure, enabling efficient transmission and processing.
- Resource: Clearly defines the origin of the data (service, host information).
- Scope: Specifies the library information used for data collection.
- Data: Contains the actual content, such as traces (spans), metrics (data points), and logs (log records).
Thanks to this clear and detailed structure, systems using OTel can easily collect, analyze, and visualize data even in distributed environments, gaining a complete understanding of operational status! 👍
Leave a Reply