We start our day by checking the weather every morning. Phrases like “It’s hot today” or “It’s humid and sticky” are deeply embedded in our daily lives. Surprisingly, this is the most basic form of ‘environmental data’.
Today, from the perspective of systems and technology, we will delve into Environmental Data, which measures the physical environment around us, in an easy-to-understand yet in-depth manner.
🤔 What is Environmental Data?
Simply put, environmental data is quantified information about the physical environment surrounding a system or equipment in operation. Just as humans feel temperature and humidity with their skin and detect pressure changes with their ears, systems ‘sense’ their surroundings through sensors.
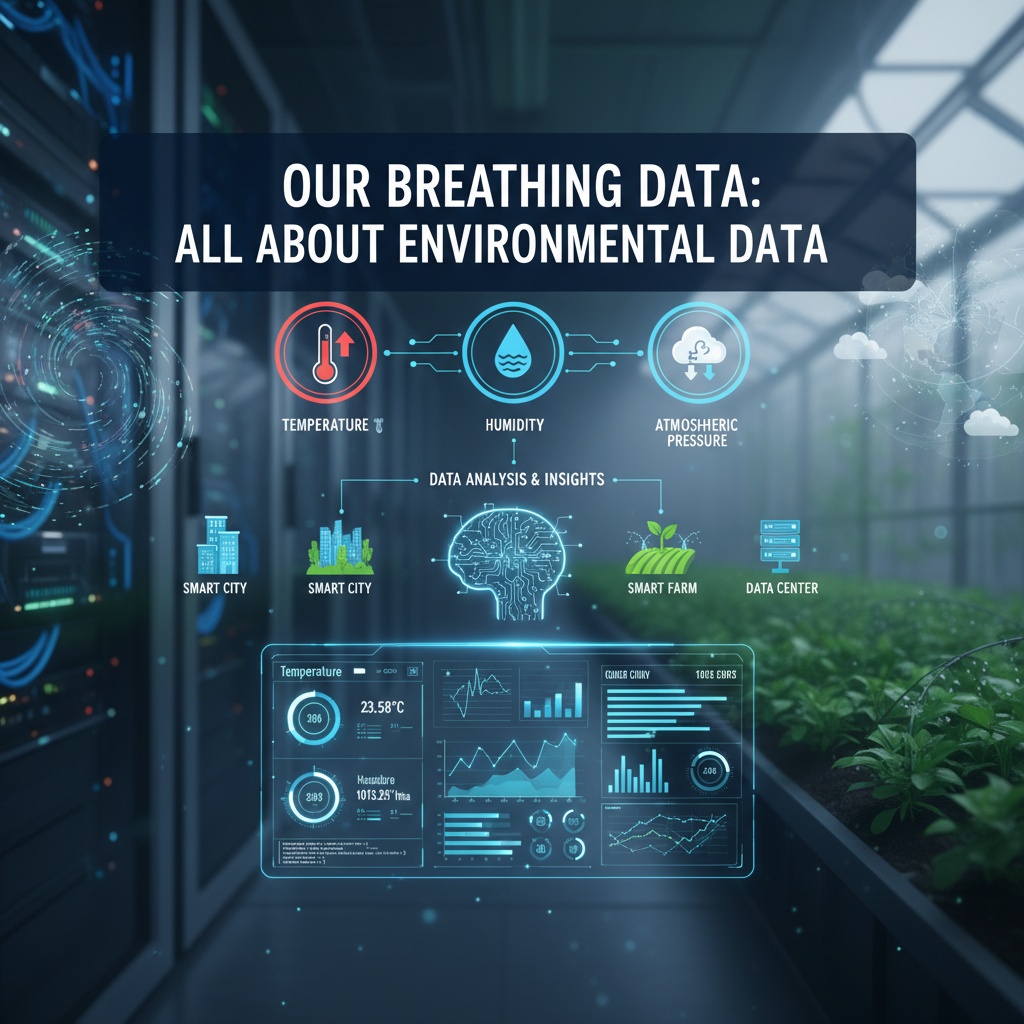
The core trio of this data is temperature, humidity, and atmospheric pressure.
✨ The Trio of Environmental Data: Temperature, Humidity, and Atmospheric Pressure
Let’s examine what each data point means individually and why it is important.
1. Temperature 🌡️
- What is it?: A measure of how cold or hot the air is.
- Why is it important?:
- Electronic Devices: Most electronic components operate most efficiently within a specific temperature range. Too high temperatures can lead to performance degradation and shortened lifespan due to overheating. (e.g., servers in data centers)
- Biology/Chemistry: It serves as an absolute standard in temperature-sensitive fields such as plant growth, chemical reaction rates, and pharmaceutical storage.
- Daily Life: Used in smart homes to automatically control heating and cooling systems for user comfort.
2. Humidity 💧
- What is it?: Refers to the amount of water vapor contained in the air.
- Why is it important?:
- Corrosion and Static Electricity: Too high humidity can corrode metal components, while too low humidity can generate static electricity, potentially damaging sensitive electronic devices.
- Health: Appropriate humidity is important for respiratory health; too high humidity can cause mold or bacterial growth.
- Preservation: Maintaining appropriate humidity is essential for artifacts in museums and ancient books in libraries.
3. Atmospheric Pressure 💨
- What is it?: The pressure exerted by the weight of the air. The higher the altitude, the lower the atmospheric pressure.
- Why is it important?:
- Weather Prediction: Low pressure usually indicates bad weather accompanied by rain or snow, while high pressure signifies clear weather. Changes in atmospheric pressure are key indicators for weather forecasting.
- Altitude Measurement: Used in smartphones, drones, and hiking watches to measure the current altitude.
- Precision Processes: Some precision processes, such as semiconductor manufacturing, require maintaining a specific atmospheric pressure environment.
🌐 Beyond Individual Data, Seeing the Whole Context
While understanding temperature, humidity, and atmospheric pressure individually is important, true value emerges when these data points are integrated to grasp the overall context.
For example, let’s consider a smart farm 🌱.
- Crops won’t grow well by just increasing the temperature.
- Too high humidity can lead to pests and diseases.
- A sudden drop in atmospheric pressure could be a sign of an impending storm.
A smart farm system analyzes temperature, humidity, and atmospheric pressure data in real-time to make complex decisions such as:
“The temperature is adequate, but humidity is rising, so I should activate the ventilation fan. External atmospheric pressure is dropping rapidly, so I need to close the greenhouse windows in preparation for a storm!”
By looking at multiple environmental data points together, we can gain insights that single data points couldn’t provide and respond more smartly.
💻 How is Data Collected and Utilized?
So, how is this data actually processed in systems? Let’s look at a simple process with code. Sensors like BME280 can measure temperature, humidity, and atmospheric pressure all at once.
1. Sensor Data Collection and Transmission (Python Example)
This is virtual code that converts data read from a sensor into JSON, the most common data format.
import json
import datetime
import random

def read_environmental_sensor_data():
    """
    BME280과 같은 환경 센서에서 데이터를 읽어오는 것을 시뮬레이션합니다.
    실제 환경에서는 센서 라이브러리를 사용하여 값을 읽어옵니다.
    """
    temperature = round(random.uniform(22.0, 25.0), 2)  # Celsius temperature
    humidity = round(random.uniform(40.0, 45.0), 2)     # Relative humidity (%)
    pressure = round(random.uniform(1012.0, 1015.0), 2) # Hectopascal (hPa)

    # Structure the measured data as a dictionary
    sensor_data = {
        "timestamp": datetime.datetime.now().isoformat(),
        "device_id": "SN-A1B2-C3D4",
        "location": "ServerRoom-01",
        "data": {
            "temperature_celsius": temperature,
            "humidity_percent": humidity,
            "pressure_hpa": pressure
        }
    }
    return sensor_data

# Read sensor data
raw_data = read_environmental_sensor_data()

# Convert to JSON string format (for sending to server or saving to file)
json_output = json.dumps(raw_data, indent=4)

print(json_output)
2. Collected Raw Data (JSON)
Running the above code generates structured data like the following. This data is then transmitted to a server for storage or analysis.
{
    "timestamp": "2025-11-03T08:48:00.123456",
    "device_id": "SN-A1B2-C3D4",
    "location": "ServerRoom-01",
    "data": {
        "temperature_celsius": 23.58,
        "humidity_percent": 42.11,
        "pressure_hpa": 1013.25
    }
}
3. Data Utilization 📈
The collected data is utilized as follows:
- Dashboard Visualization: Quickly grasp the current environmental status.
- Anomaly Detection: Send alerts (SMS, email) to administrators if a set threshold (e.g., temperature above 30 degrees Celsius) is exceeded.
- Automatic Control: Activate cooling fans based on temperature or turn on humidifiers based on humidity.
- Long-term Data Analysis: Analyze seasonal environmental change patterns to optimize energy efficiency.
Conclusion
Environmental data is not just a sequence of numbers. It is the language through which systems understand and communicate with the world around us. By understanding the basic elements of temperature, humidity, and atmospheric pressure, and by interpreting the overall context they create together, we can finally build safer, more efficient, and smarter environments.
Please remember that ‘environmental data’ is always at the heart of future technologies such as IoT, smart cities, and precision agriculture!
Leave a Reply