Hello everyone! We are your companion on the Observability journey, responsible for the health of your applications. 🩺 Today, we’re going to delve deep into one of OpenTelemetry’s most fundamental and core concepts: the Event Model.
The impressive graphs and statistics we see on dashboards all originate from very small pieces of data. Shall we uncover the secret of how these initial data fragments are generated and recorded?
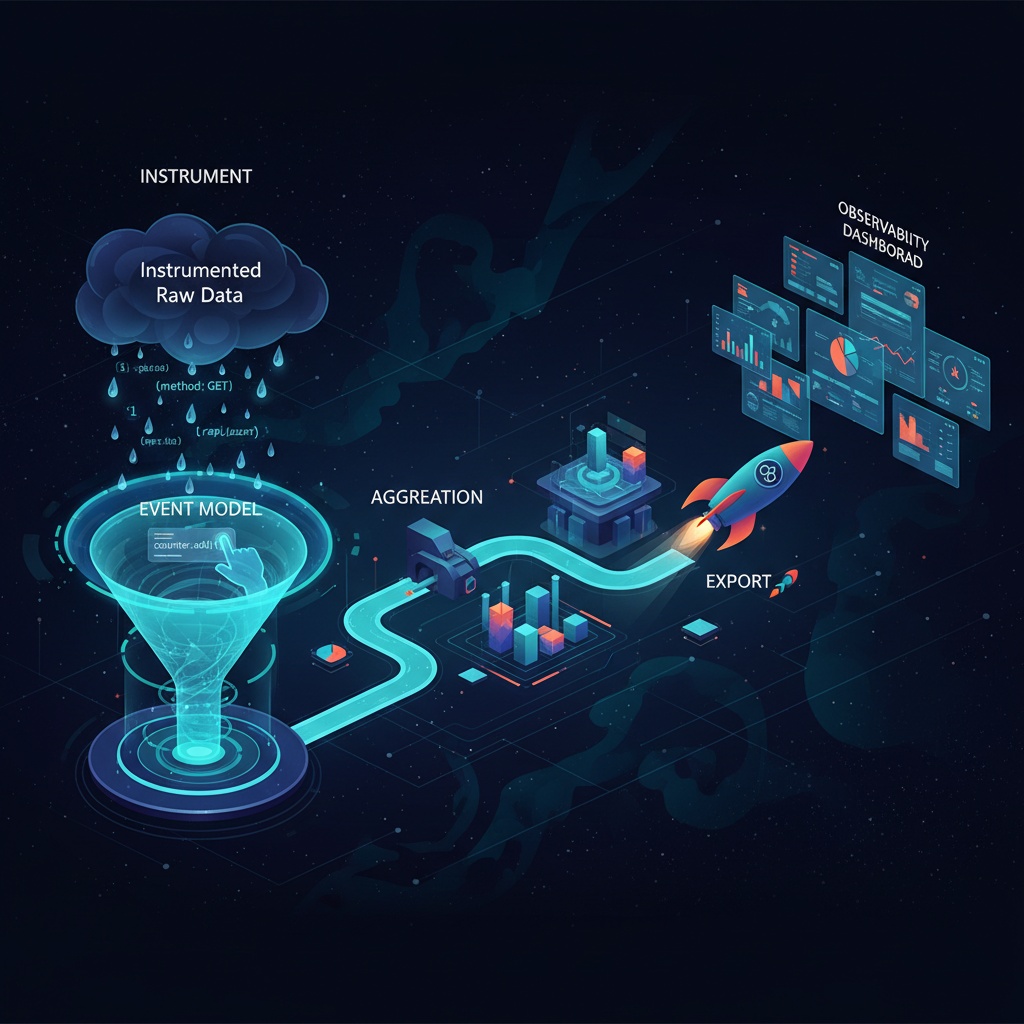
🤔 What is the OpenTelemetry Event Model?
Simply put, the OpenTelemetry Event Model refers to the very act of “recording individual measurements generated by an Instrument.”
What does this mean? Let’s use an analogy.
💧 Imagine we are measuring hourly rainfall. Before we get the aggregated data “10mm per hour,” we need a process to detect each individual raindrop falling from the sky.
>
The OpenTelemetry Event Model is precisely this stage of recording ‘each individual raindrop.’ It is the purest, unprocessed form of raw data observations, before anything is combined or averaged.
This model is responsible for the most primitive data stream before data is aggregated or exported to external systems.
🗺️ The Event Model’s Place in the Overall Picture
Understanding the event model in isolation can be difficult. It becomes clearer when we examine where it fits within OpenTelemetry’s overall data processing flow.
Here is the journey of a single metric data point until it reaches us:
- Code Instrumentation 👨💻
- Developers embed ‘Instruments’ within the code to measure specific values. (e.g., a Counter to count HTTP requests)
- Measurement & Event Generation ✨
- As the application runs, actual events occur. (e.g., a user calls an API)
- At this point, the instrumented code records individual measurements via commands like counter.add(1).
- This very moment, this action, is where the ‘Event Model’ operates! Each of these individual records is a ‘raw data observation.’
- Aggregation 📊
- The OpenTelemetry SDK collects multiple ‘raw data observations’ that occurred over a certain period.
- It then processes (aggregates) them into meaningful statistical data. (e.g., “There were 120 calls to /api/users in the last minute.”)
- Export 🚀
- The aggregated metric data is sent to the monitoring backends we use, such as Prometheus, Jaeger, and Datadog.
Thus, the event model acts as the very first step in the entire Observability pipeline, serving as the starting point for all data.
💻 Looking at Real Code: How are Events Recorded?
Seeing is believing! Let’s look at a simple Python code example to understand how the event model works.
1. Creating an Instrument (Measurement Tool)
First, we define an instrument named Counter to measure the number of HTTP requests.
# Import necessary libraries
from opentelemetry import metrics

# Configure MeterProvider and get Meter
meter_provider = metrics.get_meter_provider()
meter = meter_provider.get_meter("my-app-meter", "1.0")

# Create a Counter instrument named 'http.server.requests'
http_requests_counter = meter.create_counter(
    name="http.server.requests",
    description="Number of incoming HTTP requests",
    unit="1"
)
2. Recording Events (This is the core!)
Now, when an actual HTTP request comes in, we use this instrument to record the measurement.
def handle_http_request(route, method):
    # ... request processing logic ...
    print(f"Request received for {method} {route}")

    # ✨ This is where the event model operates! ✨
    # Record a raw data observation of '1' along with route and method.
    http_requests_counter.add(1, {"http.route": route, "http.method": method})

# Actual function call
handle_http_request("/api/users", "GET")
In the code above, the line `http_requests_counter.add(1, …)` is precisely the act of “recording a raw data observation,” and it is a concrete implementation of the OpenTelemetry Event Model.
At this point, the Raw Data conceptually generated internally by the SDK would look something like this (actual protocol may differ):
{
  "instrument": "http.server.requests",
  "timestamp": "2025-11-03T08:40:01.123Z",
  "value": 1,
  "attributes": {
    "http.method": "GET",
    "http.route": "/api/users"
  }
}
Each of these JSON objects is a ‘raindrop,’ and the OpenTelemetry SDK collects them to form the final metric, ‘hourly rainfall.’
💡 Why is this Model Important?
- Foundation of Flexibility: By recording raw data at the smallest unit, it opens up the possibility for flexible aggregation in any way later on.
- Performance: In application code, you simply declare ‘measurement occurred!’ without complex calculations. Heavy aggregation tasks are handled by the SDK in the background, minimizing impact on application performance.
- Source of All Metrics: All types of metrics we see on dashboards, such as Counter, Gauge, and Histogram, are actually the result of these small ‘raw data observations’ being collected.
Conclusion: Everything Starts with a Single Measurement
The OpenTelemetry Event Model is like a core engine that silently performs its role behind the scenes. Behind the impressive graphs lie countless ‘raw data observations’ diligently recorded by instruments!
Now you precisely understand how the first domino 🎲 in the OpenTelemetry data pipeline falls. Based on this fundamental understanding, we hope you will build even more in-depth Observability systems!
Leave a Reply