“My code clearly works fine, so why is the overall service slow?” “What parameters were passed when service A called service B?”
As Microservices Architecture (MSA) becomes more complex, finding the root cause of failures or analyzing performance bottlenecks becomes increasingly difficult. It feels like getting lost in a giant maze. 😭
In this crisis of ‘Observability’, OpenTelemetry (Otel for short) comes to our rescue. Today, for developers lost in the MSA hell, we will explore everything about OpenTelemetry from A to Z!
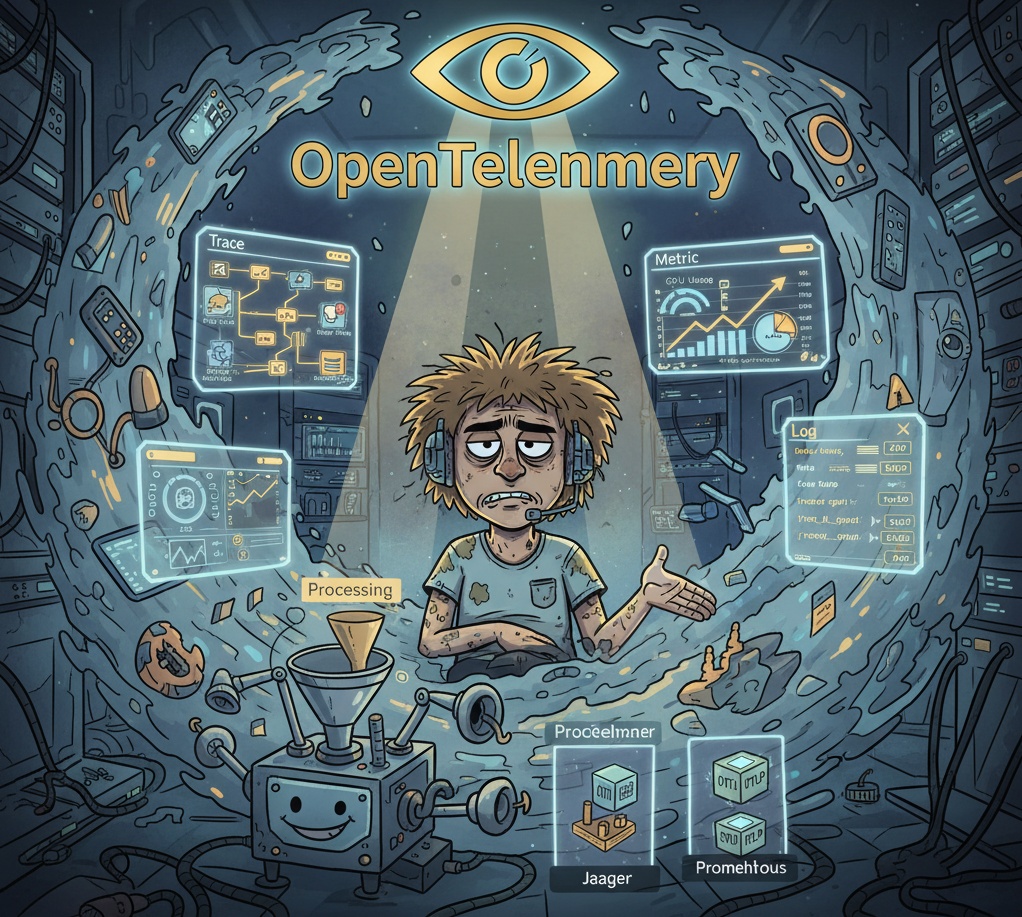
🤔 So, what exactly is OpenTelemetry?
OpenTelemetry is an open-source framework that standardizes the way observability data is generated and collected. In the past, each vendor (Datadog, New Relic, etc.) or technology (Jaeger, Prometheus) had its own distinct method for collecting data. Otel unifies all of this, making it easy to think of it as a ‘standard specification’ that allows data to be collected and transmitted in the same way, regardless of the system used.
The overall flow is like this:
Application (Data Generation) ➡️ OpenTelemetry Collector (Intermediate Processing) ➡️ Observability Backend (Jaeger, Prometheus, etc.)
Thanks to this structure, we gain the flexibility to freely change the destination for sending data with almost no modification to the application code. ✨
1️⃣ OpenTelemetry’s 3 Core Data Types: Signals
Otel collects three core data types, or ‘signals’, to observe a system.
🗺️ Traces: Tracking the Entire Journey of a Request
It shows the entire process of a user request, from entering the system to exiting, through all services and components, bundled as a single journey. It’s like tracking a package to see where it is.
- Trace: The entire journey for a single request. (e.g., entire product order request)
- Span: A single unit of work within a journey. (e.g., login verification, inventory check, calling payment API)
Span Structure (Example)
>
`
{
“name”: “HTTP GET /api/products”,
“trace_id”: “0af7651916cd43dd8448eb211c80319c”,
“span_id”: “b7ad6b7169203331”,
“parent_span_id”: “f3a4a75a9d201b5a”,
“start_time”: “2025-11-09T11:41:00.123Z”,
“end_time”: “2025-11-09T11:41:00.345Z”,
“attributes”: {
“http.method”: “GET”,
“http.status_code”: 200,
“user.id”: “user123”
},
“events”: [
{
“name”: “Cache miss”,
“timestamp”: “2025-11-09T11:41:00.200Z”
}
]
}
`
With just this trace_id, you can link together operations (Spans) scattered across multiple microservices to understand the entire flow of a request at a glance.
📊 Metrics: Measuring the Health of Your System
Data that represents the system’s state at a specific point in time as a number. Think of a car’s dashboard.
- Counter: A value that only increases (e.g., total requests processed, total website visitors)
- UpDownCounter: A value that can increase or decrease (e.g., number of active user sessions)
- Histogram: Measures the distribution of values (e.g., 95% of API requests are processed within 100ms)
- Gauge: A value at a specific point in time (e.g., current CPU utilization, memory usage)
📝 Logs: Detailed Records of Specific Events
This is the most familiar data to us. It’s a text record of an event that occurred at a specific time. The true power of Otel logs lies in their integration with traces.
The core of Otel logs! Logs include trace_id and span_id. This allows you to immediately identify “which request (Trace) and which operation (Span) caused this error log?” No more sifting through log files to guess the cause!
2️⃣ Embedding Otel in Your Code: API & SDK
So, how do we generate this data? By adding ‘instrumentation’ code to your application via APIs and SDKs.
- API: A specification (blueprint) for “what data to collect.”
- SDK: Language-specific tools (implementations) that actually implement the API specification.
Because these two are separated, we can write code according to the API standard, and even if we change the SDK implementation later, we don’t need to modify the code.
There are two main instrumentation methods:
- Automatic Instrumentation 🪄: Without modifying code, simply adding an agent or library automatically collects data from popular frameworks (Spring, Django, etc.) or libraries (HTTP clients, DB drivers). This is the simple and powerful method to try first!
- Manual Instrumentation ✍️: For “important business logic unique to our company” that automatic instrumentation cannot capture, developers directly call the API to generate data.
3️⃣ The All-Purpose Data Hub: OpenTelemetry Collector
Sending data generated by applications directly to the backend is inefficient and risky. It can burden the application, and changing the backend would require modifying all application code.
This is where the Otel Collector comes in. The Collector acts as an independent proxy between the application and the backend, receiving, processing, and exporting data.
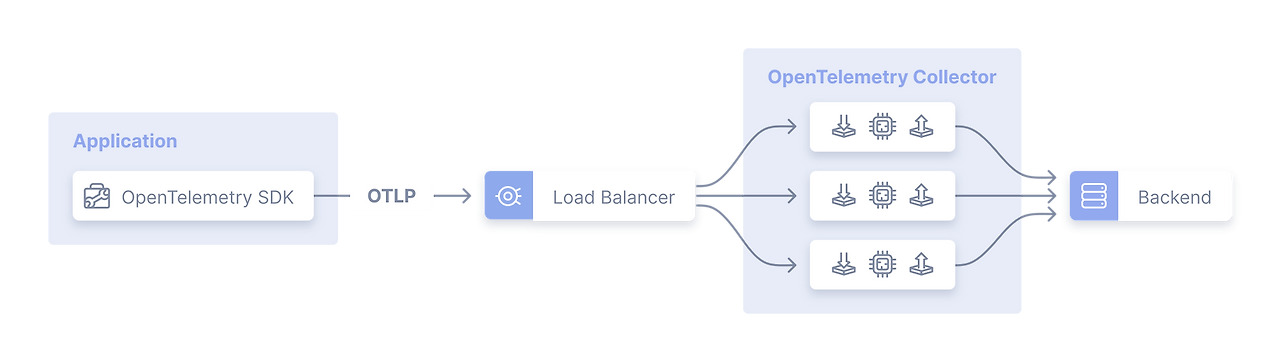
(Image Source: opentelemetry.io)
The Collector is composed of three parts, like Lego blocks:
- Receivers 📥: Accept data in various formats (OTLP, Jaeger, Prometheus, etc.).
- Processors 🛠️: Process data. This includes filtering unnecessary data, masking sensitive information, and batching data for efficient processing.
- Exporters 📤: Export processed data to its final destination (Jaeger, Prometheus, Datadog, etc.).
💡 Why should you use a Collector?
>
– Separation of Concerns: The application focuses solely on data ‘generation’, and the Collector handles ‘processing and transmission’, reducing the app’s burden.
– Flexibility: Want to send data to Jaeger and Prometheus simultaneously? Just change one line in the Collector’s configuration file! No need to touch the app code.
– Performance: Using a Batch Processor maximizes network efficiency by collecting and sending data in batches. This is why BatchSpanProcessor is strongly recommended over SimpleSpanProcessor (which sends spans immediately as they are created) in production environments.
Collector Configuration File Example (config.yaml)
How the Collector operates is fully explained by this single configuration file.
# config.yaml for OpenTelemetry Collector

receivers: # Data is received via OTLP protocol
  otlp:
    protocols:
      grpc:
      http:

processors: # Received data is batched and memory usage is limited
  batch:
  memory_limiter:
    check_interval: 1s
    limit_percentage: 75

exporters: # Processed data is sent to Jaeger and also printed to console for debugging
  otlp/jaeger:
    endpoint: "jaeger-all-in-one:4317" # Jaeger address
    tls:
      insecure: true
  logging:
    loglevel: debug

service:
  pipelines: # Connect the above components into a pipeline
    traces: # Trace data will be processed like this
      receivers: [otlp]
      processors: [batch, memory_limiter]
      exporters: [otlp/jaeger, logging]
4️⃣ The Blood Vessels of Distributed Systems: OTLP & Context Propagation
Finally, let’s understand how all these components communicate with each other.
- OTLP (OpenTelemetry Protocol) 📡: Otel’s official data transmission protocol. It acts as a ‘common language’ that all Otel components can understand.
- Context Propagation 🤝: This is the core technology of distributed tracing. When service A sends an HTTP request to service B, something magical happens behind the scenes. Trace information, such as trace_id, is carried in an HTTP header called `traceparent`.
HTTP Header Example
>
`
traceparent: 00-0af7651916cd43dd8448eb211c80319c-b7ad6b7169203331-01
`
>
Thanks to this header, service B recognizes, “Ah, this request is part of the 0af… trace!” and can link its own operations (Spans) to the same trace. Without this ‘context propagation’, distributed tracing would be impossible.
Conclusion
OpenTelemetry is not just another library or tool. It is a standard and a philosophy that allows us to transparently peer into the internals of complex modern distributed systems.
Through Otel, we can weave together data from scattered services to see the overall picture, and quickly identify and resolve issues when they arise. Don’t get lost in the maze anymore. How about setting up a bright lighthouse for your system with OpenTelemetry? 🚀
Leave a Reply