Every developer has probably used print or console.log for debugging. However, as services become more complex and start to consist of multiple microservices, these logs begin to become a headache. 🤯
- “Which server did this log come from, anyway?”
- “There’s an error log, but I can’t tell what process this request went through…”
- “The log format is different for each service, making analysis too difficult!”
To solve these problems, the standard for Observability, OpenTelemetry (OTEL), emerged. Today, we’ll easily break down how OTEL systematically collects and manages logs, revealing its mysterious internal workings.
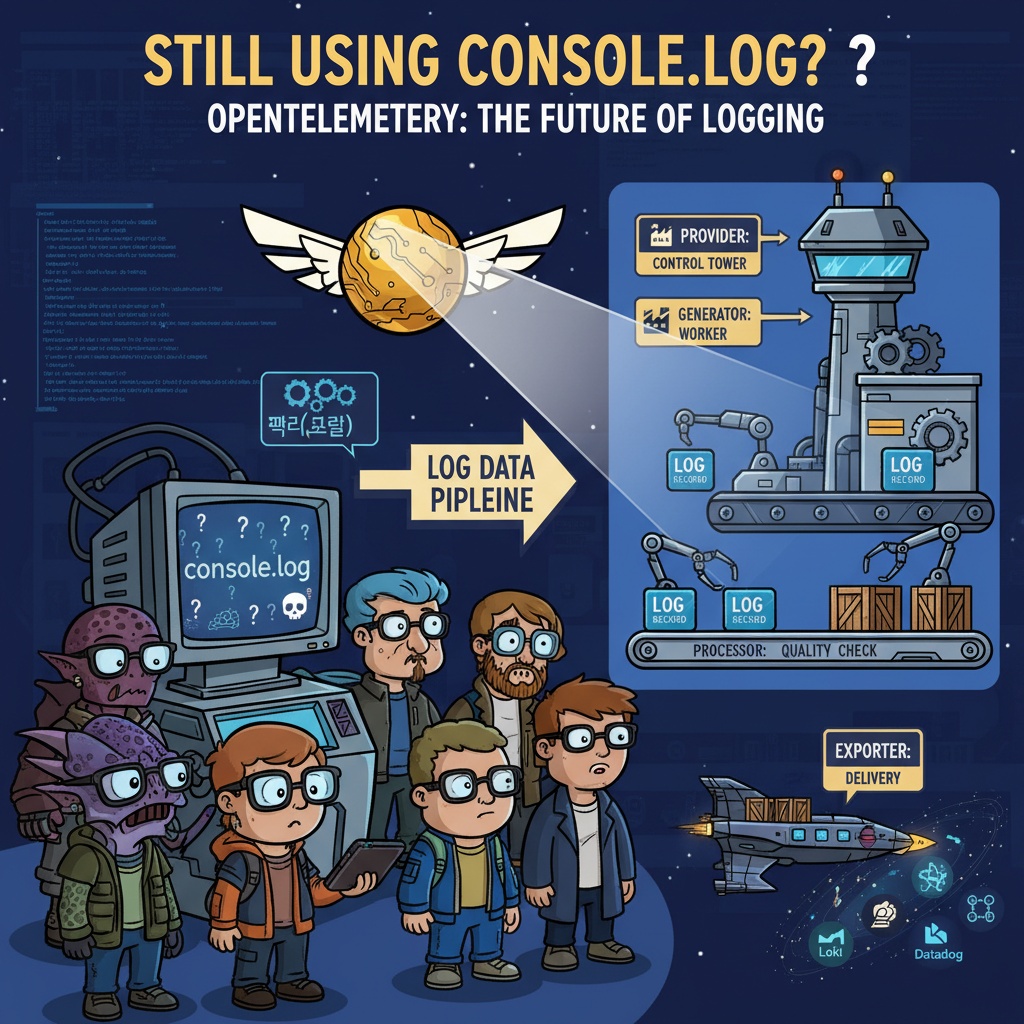
🗺️ Seeing the Big Picture: How Does Log Data Travel?
Before looking at individual components, it’s important to first understand the overall data flow, or pipeline. OTEL’s logging system is like a well-organized factory production line.
Factory Setup (Provider) → Product Manufacturing (Generator) → Quality Inspection and Packaging (Processor) → Delivery (Exporter)
Through these four stages, logs generated by an application are safely delivered to their final destination. This structure applies not only to logs but also to traces and metrics, maintaining consistency, which is a core philosophy of OTEL!
Now, shall we take a closer look at what each stage does?
🛠️ 4 Key Components of the OpenTelemetry Logging System
1. Logger Provider: The Beginning of Everything, the Control Tower 🏭
The LoggerProvider is the overall manager and designer of our logging system.
- Role: Acts as a factory that creates and manages Loggers (objects that actually record logs).
- Key Function: Applies consistent settings to all logs generated throughout the application. For example, it automatically attaches Resource information, such as “This application’s name is ‘Order Service’ and its version is ‘1.2.0’,” to all logs.
🤔 Why is this important? Without a LoggerProvider, developers would have to manually add information like service names or versions every time they log. This is prone to errors and highly inefficient. The LoggerProvider centrally manages this common information, ensuring all logs have a consistent identity.
2. Logger: The Worker on the Ground 👷
A Logger is an object that developers use to actually record logs in code.
- Role: The entity that creates actual log messages, i.e., LogRecords, such as “User login successful” or “Database connection failed.”
- Usage Example:
`
Get a Logger from the LoggerProvider.
logger = provider.get_logger(“my-app-logger”)
Use this Logger to record logs.
logger.info(“New order received.”)
`
Developers don’t need to know the complex internal structure of the LoggerProvider; they just need to get this Logger and leave the necessary messages.
3. Log Record: A Smart Data Box Containing Information 📦
A LogRecord is not just a simple text message. It is structured data containing all information about a single log event.
- Role: Contains all detailed information of a single log event.
- Included Information:
- Body: The actual log message (e.g., “Payment processing complete”)
- Timestamp: The time the log occurred
- Severity: The severity of the log (INFO, WARN, ERROR, etc.)
- Attributes: Additional information (e.g., user_id: 123, order_id: “A-5678”)
- Context: The most important part! 🤩 It includes context information like trace_id and span_id, which accurately links this log to the request processing flow (Trace) during which it occurred.
Raw Data Example
Let’s look at what a LogRecord actually looks like in JSON format:
{
  "Timestamp": "2025-11-11T09:36:00.123456789Z",
  "ObservedTimestamp": "2025-11-11T09:36:00.123456789Z",
  "TraceId": "0x5b8aa5a2d2c872e8321cf37308d69df2",
  "SpanId": "0x14214c1a4a2ac7c1",
  "SeverityText": "Info",
  "SeverityNumber": 9,
  "Body": "사용자(id: 123)가 장바구니에 상품(id: 456)을 추가했습니다.",
  "Attributes": {
    "userId": 123,
    "productId": 456,
    "http.method": "POST",
    "http.route": "/cart/items"
  },
  "Resource": {
    "service.name": "cart-service",
    "service.version": "1.1.0"
  }
}
As you can see, it’s not just simple text, but rich with information about which service (cart-service) it originated from and which request (TraceId) it’s related to. This is why OTEL logging is so powerful.
4. Log Record Exporter: Delivery to the Final Destination 🚚
The LogRecordExporter is responsible for sending well-formed and processed log records to external systems.
- Role: Exports processed log data to its final destination.
- Main Destinations:
- Log collection and analysis tools like Loki, Elasticsearch
- Commercial monitoring solutions like Datadog, New Relic
- Console output for testing or debugging
Note: In the middle of the pipeline, there is a stage called LogRecordProcessor. This processor performs efficient intermediate processing tasks, such as reducing network load through batch processing or filtering logs based on specific conditions, before exporting logs externally.
✨ Conclusion: Treating Logs Like Data
The OpenTelemetry logging system goes beyond simple text recording, treating logs as structured data with rich context.
- It provides consistency to all logs via the Provider,
- Easily creates logs with the Logger,
- Includes trace information in the LogRecord to accurately track the root cause of problems, and
- Effortlessly sends them to the desired analysis system via the Exporter.
Now, break free from the console.log swamp and experience the world of true observability with OpenTelemetry, where you can grasp the system’s status at a glance and quickly resolve issues!
Leave a Reply