“Without executing the code, we can read the hidden intentions within it.”
The first gateway to static analysis, opened with radare2.
<
What this article covers
- A safe method to extract assembly from malware PE files without executing them
- Pre-reconnaissance techniques using rabin2 to quickly collect PE headers, imports, and strings
- Function-level disassembly using r2’s core commands (aaa, afl, pdf)
- Batch (headless) technique to save extracted assembly as clean .asm text files
- Isolation environment and safety rules that analysts must adhere to
Why radare2?
When starting malware analysis, most people think of IDA Pro or Ghidra. Both are excellent, but they are heavy and GUI-centric, which can be overkill when you “just want to quickly look at one function.”
radare2 (r2 for short) is on the opposite end. It’s a lightweight, fast, terminal-based reverse engineering framework, pre-installed on Kali Linux, so you can use it right away without any extra setup. Most importantly, it’s easy to automate with scripts, making it powerful for batch extracting assembly of specific functions from dozens of samples.
The key is this: disassembly via r2 is static analysis. This means it never executes the malware; it merely translates the machine code inside the file into human-readable assembly. This implies there’s no risk of system infection from the analysis itself.
Key Concepts Explained
What is a PE File?
PE (Portable Executable) is the executable file format for Windows. .exe, .dll, and .sys are all PE formats, and internally they are structured with a .text section containing code, a .data section containing data, an import table, and an entry point address. Since most malware targets Windows, PE analysis is a fundamental skill for analysts.
Disassembly
Compiled binaries contain machine code that is difficult for humans to read. The process of translating this into assembly instructions like mov, push, and call is called disassembly. radare2 performs this task with a single command line.
radare2 Toolset
- r2 — Interactive main console. The core of analysis and disassembly
- rabin2 — A tool for extracting metadata (headers, imports, strings) from binaries like PE/ELF
- r2 Scripting — Automating execution by pre-inserting commands with the -c option
Hands-on: Step-by-step Commands for Assembly Extraction
Step 0 — Isolation Environment and Sample Integrity Check
Analysis must be performed in an isolated VM (with snapshot recovery capability) disconnected from the internet. First, record the sample’s identity and hash.
bash
# Check file type — Verify if it's a PE executable
file sample.exe

# Record hash — For future threat intelligence (VirusTotal, etc.) lookup
sha256sum sample.exe
The hash serves as an identifier for analysis reports, so it’s good practice to record it first.
Step 1 — Pre-reconnaissance with rabin2
Before entering the console, use rabin2 to get an overall outline. It’s very safe as it only reads headers without execution.
# Binary basic information (architecture, bits, compiler, entry)
rabin2 -I sample.exe

# PE header field details
rabin2 -H sample.exe

# Import function list — Key clue for inferring malicious behavior
rabin2 -i sample.exe

# Export functions (useful for DLL analysis)
rabin2 -E sample.exe

# Entry point address
rabin2 -e sample.exe

# String extraction — Reveals URLs, commands, registry keys, etc.
rabin2 -z sample.exe
The imports shown by rabin2 -i are particularly important. If APIs like CreateRemoteThread, VirtualAllocEx, or WinHttpOpen are visible, you might suspect code injection or external communication.
Step 2 — Loading with r2 and Automatic Analysis
Now, enter the main console. The -A option performs a full analysis (aaa) immediately upon loading.
# -A : Execute aaa (automatic analysis) immediately upon loading
r2 -A sample.exe
If opened without -A, run the analysis directly within the console.
[0x00401000]> aaaaaa (analyze all) is a core r2 analysis command that automatically identifies function boundaries, call relationships, and string references. For large samples, it may take some time, so please wait.
Step 3 — Check Function List
Once the analysis is complete, list the identified functions.
[0x00401000]> aflafl (analyze function list) displays the address, size, and name of each function in a table. If you want to see only specific names, use r2’s built-in grep (~).
[0x00401000]> afl~main
[0x00401000]> afl~entry
Step 4 — Disassemble Assembly
Finally, the core part. Output assembly at the function level.
# Disassemble the entire entry point function
[0x00401000]> pdf @ entry0

# Move to current position and print function
[0x00401000]> s entry0
[0x00401000]> pdf

# Disassemble a specific function (using the name confirmed in afl)
[0x00401000]> pdf @ sym.malicious_routine

# Print only 50 instructions from a specific address
[0x00401000]> pd 50 @ 0x00401230
pdf (print disassembly function) disassembles an entire function, while pd N disassembles only a specified number of instructions. Remembering the difference between the two allows you to choose appropriately for the situation.
Step 5 — View Flow in Visual Mode
If you want to see the control flow as a graph rather than a list of instructions, use visual mode.
# Visual disassembly mode (q to quit, p to switch views)
[0x00401000]> V

# Function control flow graph
[0x00401000]> VV
VV’s graph view allows you to grasp branching and looping structures at a glance, which is particularly useful when understanding complex unpacking routines.
Step 6 — Extract Assembly to File (Automation)
An analyst’s true weapon is automation. You can inject commands using the -q -c options without entering the console to extract results into a text file.
# Save only the entry function as clean text (color codes removed)
r2 -q -c "e scr.color=0; aaa; pdf @ entry0" sample.exe > entry0.asm

# Disassemble all functions at once — @@f iterates per function
r2 -q -c "e scr.color=0; aaa; pdf @@f" sample.exe > all_functions.asm

# Function list only as text
r2 -q -c "aaa; afl" sample.exe > functions.txt
Here, e scr.color=0 is a setting to turn off terminal color codes. If you omit this, ANSI escape characters will be mixed into the file, making it messy, so be sure to include it. @@f is r2’s iteration operator, meaning to execute pdf sequentially for all identified functions.
If you want more readable output, adjust additional settings.
# Hide left flow lines and hex bytes to extract pure assembly only
r2 -q -c "e scr.color=0; e asm.lines=false; e asm.bytes=false; aaa; pdf @@f" sample.exe > clean.asm
The extracted .asm files can be immediately used as analysis data, for example, to search for specific API calls with grep or to compare code similarity between different variants.
⚠️ Precautions and Common Mistakes
- Never handle samples directly on the host. Perform analysis only in an isolated VM with snapshot capability, and block network access. While r2 itself doesn’t execute the sample, accidental double-clicks can always happen.
- Disassembly of packed samples may be meaningless. If packed with UPX or similar, the visible code might only be the unpacking stub. If the entropy in rabin2 -I results is abnormally high or section names resemble UPX0, consider unpacking first.
- Don’t forget to remove color codes. If you extract to a file without e scr.color=0, control characters like ^[[31m will be mixed in.
- aaa might not catch all functions. Obfuscated code can sometimes cause automatic analysis to miss function boundaries. In such cases, manually call af (define function) at the suspicious address, then pdf.
- Adhere to legal and ethical boundaries. Analyze samples only with proper authorization and in appropriate environments. The purpose of analysis is to strengthen defense and detection capabilities.
✅ Summary
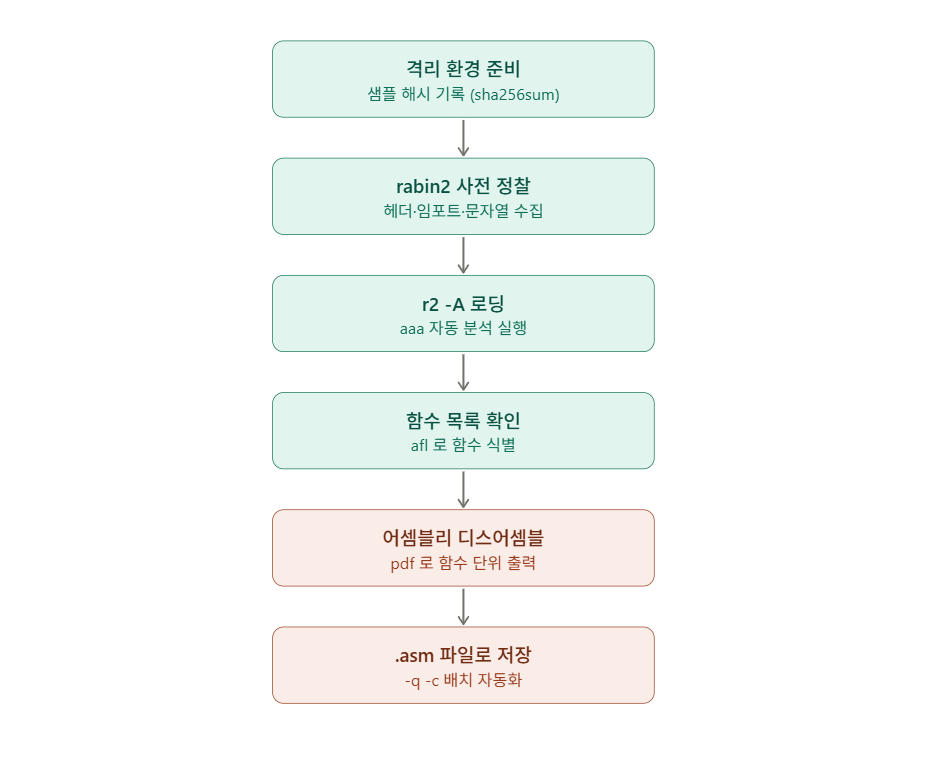
To summarize the workflow covered today in one sentence: Prepare isolation environment → Reconnaissance with rabin2 → Analyze with r2 -A → Identify functions with afl → Extract assembly with pdf → Automatic saving with -q -c.
While radare2’s commands might seem unfamiliar at first, you’ll quickly get the hang of it once you realize its command system is structured into four categories: i (info), a (analyze), p (print), and s (seek). As you build up the skill of reading assembly through static analysis, transitioning to dynamic analysis (debugging) and behavioral analysis will become much smoother.
Recommended Next Steps
- Introduction to dynamic analysis with r2’s debugger mode (r2 -d)
- Attempting pseudo-C code decompilation with pdc or r2dec plugins
- Concurrent graph analysis with Cutter (radare2 GUI)
- Automating variant detection in conjunction with YARA rule creation
Leave a Reply