Hello, developers! Today, I’ve brought some very special news for those of you struggling with application performance issues. It’s about OpenTelemetry’s new signal, ‘Profiles’.
🤔 “Where exactly is it slow?” The never-ending hide-and-seek
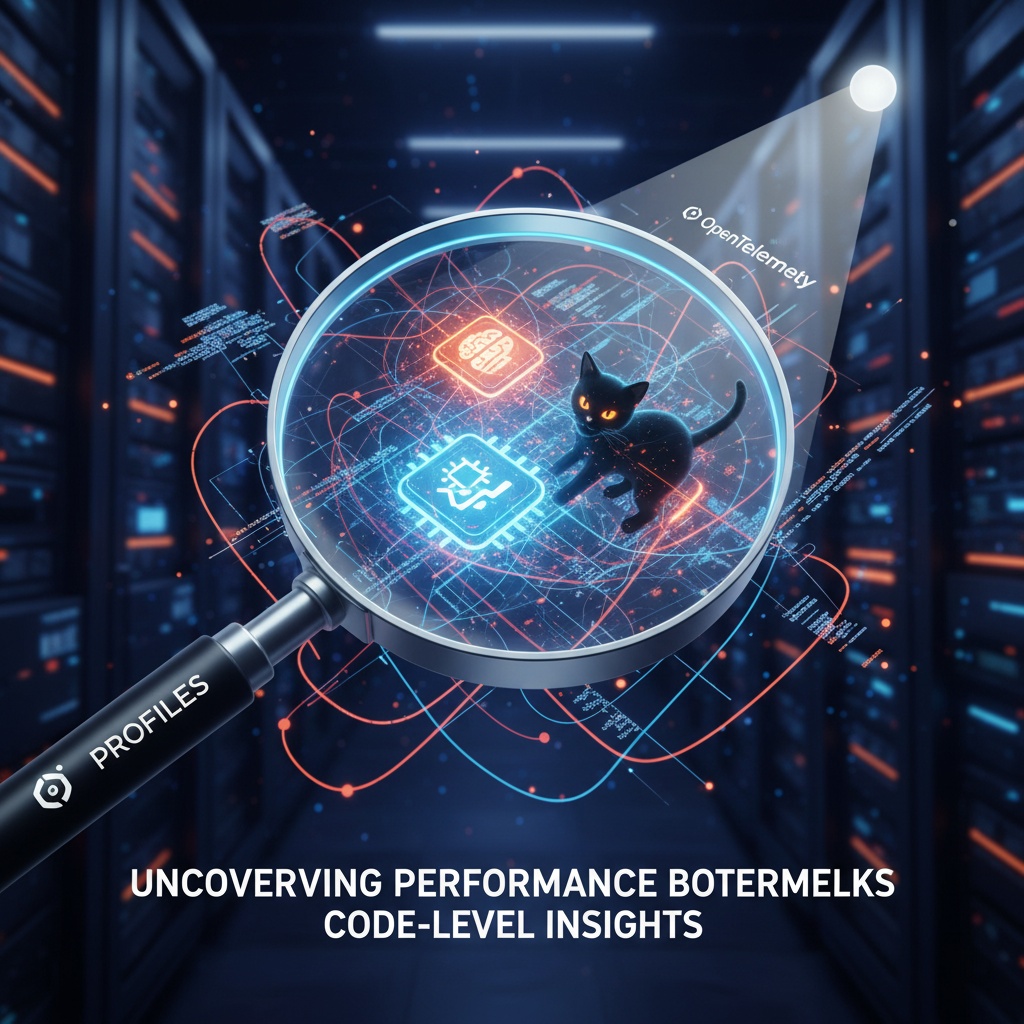
It’s really difficult to figure out why our application is slow or which parts are consuming excessive resources. It’s like looking for a black cat in a dark room. 🐈⬛ Logs and metrics alone often make it hard to identify deep-seated problems at the code level.
A solution has emerged to resolve this frustrating situation: OpenTelemetry Profiles!
📸 Capturing the moment of performance bottlenecks, Profiles!
OpenTelemetry Profiles is a feature specifically designed to diagnose application performance bottlenecks. Simply put, you can think of it as a technology that takes ‘snapshots’ of specific moments in your application, just like taking a photo.
These snapshots, or ‘profiles’, contain very important information.
- CPU Usage 📈: “Which function is using so much CPU?”
- Memory Allocation 🧠: “Where is the memory leak occurring?”
Profiles precisely capture and record how CPU and memory are being used at the exact moment code is executing.
🔍 How do we find problems?
- Snapshot Collection 📸: OpenTelemetry Profiles collects resource usage snapshots (profiles) periodically or when specific events occur while the application is running.
- Detailed Analysis 🔬: By analyzing the collected profile data, you can clearly identify which functions or specific lines of code are using significantly more CPU resources or allocating memory abnormally compared to others.
- Accurate Root Cause Identification ✅: No more guessing “It’s probably because of this part”! Through the data provided by Profiles, we can directly find the exact cause of performance degradation at the code level.
✨ Reasons to use Profiles
- Accurate Diagnosis: Pinpoint bottlenecks precisely based on data, not intuition or guesswork.
- Efficient Optimization: Knowing the exact problem area allows for efficient optimization of only the critical parts, without unnecessary code modifications.
- Improved User Experience: Enhance application responsiveness and stability, providing a better experience for users. A smooth service is a shortcut to user satisfaction! 💖
Now, end the hide-and-seek with application performance using OpenTelemetry Profiles. It’s time to uncover hidden performance bottlenecks and build better services with optimized code!
Leave a Reply